Whirlpool 2010 Annual Report Download - page 8
Download and view the complete annual report
Please find page 8 of the 2010 Whirlpool annual report below. You can navigate through the pages in the report by either clicking on the pages listed below, or by using the keyword search tool below to find specific information within the annual report.-
 1
1 -
 2
2 -
 3
3 -
 4
4 -
 5
5 -
 6
6 -
 7
7 -
 8
8 -
 9
9 -
 10
10 -
 11
11 -
 12
12 -
 13
13 -
 14
14 -
 15
15 -
 16
16 -
 17
17 -
 18
18 -
 19
19 -
20
-
21
-
22
-
23
-
24
-
25
-
26
-
27
-
28
-
29
-
30
-
31
-
32
-
33
-
34
-
35
-
36
-
37
-
38
-
39
-
40
-
41
-
42
-
43
-
44
-
45
-
46
-
47
-
48
-
49
-
50
-
51
-
52
 |
 |
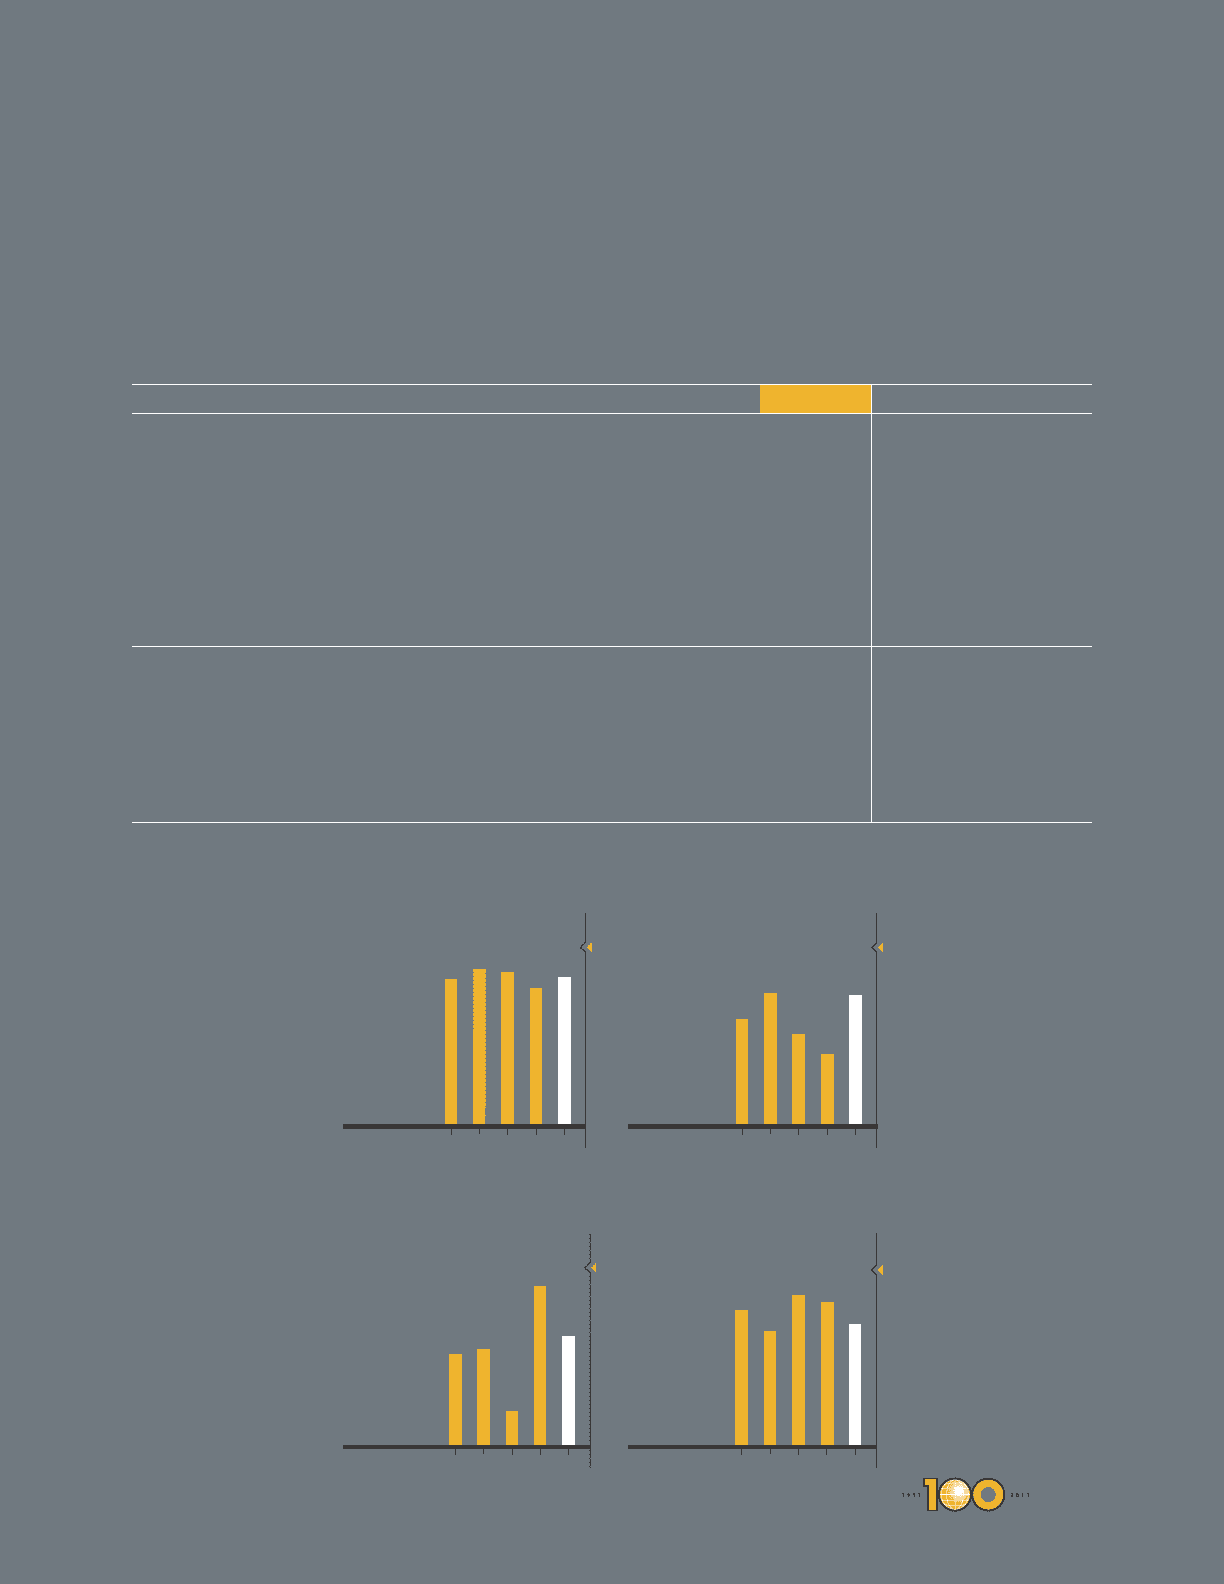
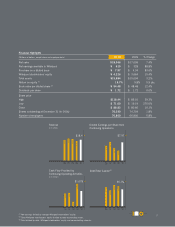
Financial Highlights
(Millions of dollars, except share and employee data) 2010 2009 % Change
Net sales $ 18,366 $ 17,099 7.4%
Net earnings available to Whirlpool $ 619 $ 328 88.8%
Per share on a diluted basis $ 7.97 $ 4.34 83.6%
Whirlpool stockholders’ equity $ 4,226 $ 3,664 15.4%
Total assets $ 15,584 $ 15,094 3.2%
Return on equity (1) 15.7% 9.8% 5.9 pts.
Book value per diluted share (2) $ 54.48 $ 48.48 12.4%
Dividends per share $ 1.72 $ 1.72 0.0%
Share price
High $ 118.44 $ 85.01 39.3%
Low $ 71.00 $ 19.19 270.0%
Close $ 88.83 $ 80.66 10.1%
Shares outstanding at December 31 (in 000s) 76,030 74,704 1.8 %
Number of employees 70,800 66,900 5.8%
Revenue
$ in millions
’06 ’07 ’08 ’09 ’10
Cash Flow Provided by
Continuing Operating Activities
’06 ’07 ’08 ’09 ’10
Diluted Earnings per Share from
Continuing Operations
’06 ’07 ’08 ’09 ’10
Debt/Total Capital
’06 ’07 ’08 ’09 ’10
$ in billions
$18.1
$19.4
$18.9
$17.1
$880
$927
$327
$1,550
41.2%
34.5%
46.0%
43.6%
$6.35
$8.10
$5.50
$4.34
$18.4 $7.97
$1,078 36.7%
(3)
(1) Net earnings divided by average Whirlpool stockholders’ equity.
(2) Total Whirlpool stockholders’ equity divided by total outstanding shares.
(3) Debt divided by debt, Whirlpool stockholders’ equity and noncontrolling interests.
7