Whirlpool 2010 Annual Report Download - page 4
Download and view the complete annual report
Please find page 4 of the 2010 Whirlpool annual report below. You can navigate through the pages in the report by either clicking on the pages listed below, or by using the keyword search tool below to find specific information within the annual report.-
 1
1 -
 2
2 -
 3
3 -
 4
4 -
 5
5 -
 6
6 -
 7
7 -
 8
8 -
 9
9 -
 10
10 -
 11
11 -
 12
12 -
 13
13 -
 14
14 -
 15
15 -
16
-
17
-
18
-
19
-
20
-
21
-
22
-
23
-
24
-
25
-
26
-
27
-
28
-
29
-
30
-
31
-
32
-
33
-
34
-
35
-
36
-
37
-
38
-
39
-
40
-
41
-
42
-
43
-
44
-
45
-
46
-
47
-
48
-
49
-
50
-
51
-
52
 |
 |

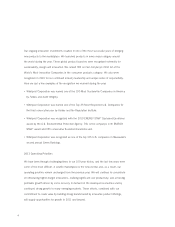
2010 Fiscal Results
We saw a return to growth in 2010 with our revenues growing 7 percent to $18.4 billion.
Net earnings per share were $7.97 per diluted share compared to $4.34 per diluted share
reported for 2009. Cash flow from continuing operations reached $1.1 billion, and we reduced
total debt levels by approximately $400 million. In addition, we paid $132 million in dividends
while maintaining a $1.4 billion cash balance. Overall, we made strong progress toward our
value creation objectives.
Strategy Drives Performance
During the year, we saw improvements in the marketplace despite global pricing pressures
and increasing material costs. Our international businesses performed well, led by our Latin
America and Asia regions. Our North America region saw industry growth for the first time in
four years. We achieved record branded share levels during the year, and we remain confident
in the opportunities that exist in the North America market. As evidence, in 2010 we broke
ground on a new state-of-the-art cooking facility in Tennessee, part of our four-year investment
of $1 billion in our U.S. operating footprint.
We remain committed to delivering all elements of our brand-value creation strategy —
focusing on consumer-relevant innovation, providing the industry’s best service to our trade
customers and end consumers, and driving lower costs and higher product quality across our
global operations. We know that our strong brands, fueled by innovation, enable us to attract
and retain loyal customers for life. And it is through these trusted brands that we provide
strong value to our consumers.
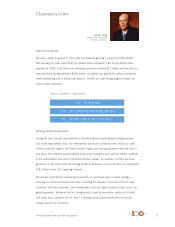
Chairman’s Letter
Jeff M. Fettig
Chairman of the Board and
Chief Executive Officer
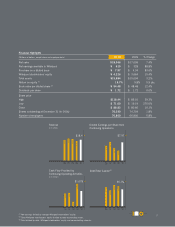
+5% – 7% REVENUE
+10% – 15% EARNINGS PER SHARE GROWTH
4% – 5% FREE CASH FLOW* % TO SALES
Value Creation Objectives
*For a definition of Free Cash Flow, see page 34. 3