Whirlpool 2010 Annual Report Download - page 42
Download and view the complete annual report
Please find page 42 of the 2010 Whirlpool annual report below. You can navigate through the pages in the report by either clicking on the pages listed below, or by using the keyword search tool below to find specific information within the annual report.
37
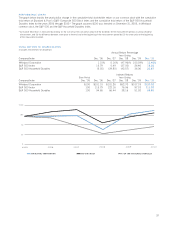
TOTAL RETUR N TO S HA REHOLDE RS
(Includes reinvestment of dividends)
Annual Return Percentage
Years Ending
Company/Index Dec. ’06 Dec. ’07 Dec. ’08 Dec. ’09 Dec. ’10
Whirlpool Corporation 1.10% 0.16% (47.96)% 103.39% 12.45%
S&P 500 Index 15.79 5.49 (37.00) 26.46 15.06
S&P 500 Household Durables (5.35) (29.80) (42.57) 36.06 22.87
Indexed Returns
Base Period Years Ending
Company/Index Dec. ’05 Dec. ’06 Dec. ’07 Dec. ’08 Dec. ’09 Dec. ’10
Whirlpool Corporation $100 $101.10 $101.26 $52.70 $107.18 $120.52
S&P 500 Index 100 115.79 122.16 76.96 97.33 111.99
S&P 500 Household Durables 100 94.65 66.44 38.16 51.92 63.80
W HI R L P O OL C O R PO R AT IO N S&P 500 I N DEX S&P 500 H O USEHO L D DUR A BLES
0
35
70
105
$14 0
200 5 2 0 06 200 7 2008 2009 2010
PERFO RMA NCE GRA PH
The graph below depicts the yearly dollar change in the cumu lative total stockholder return on our common stock with the cumulative
total return of Standard & Poor’s (S&P) Composite 500 Stock Index and the cumulative total return of the S&P 500 Household
Durables Index for the years 2006 through 2010.* The graph assumes $100 was invested on December 31, 2005, in Whirlpool
common stock, the S&P 500 and the S&P Household Durables Index.
* Cumulative total return is measured by dividing (1) the sum of (a) the cumulative amount of the dividends for the measurement period, assuming dividend
reinvestment, and (b) the difference between share price at the end and at the beginning of the measurement period by (2) the share price at the beginning
of the measurement period.


