Whirlpool 2010 Annual Report Download - page 38
Download and view the complete annual report
Please find page 38 of the 2010 Whirlpool annual report below. You can navigate through the pages in the report by either clicking on the pages listed below, or by using the keyword search tool below to find specific information within the annual report.-
 1
1 -
2
-
3
-
4
-
5
-
6
-
7
-
8
-
9
-
10
-
11
-
12
-
13
-
14
-
15
-
16
-
17
-
18
-
19
-
20
-
21
-
22
-
23
-
24
-
25
-
26
-
27
-
 28
28 -
 29
29 -
 30
30 -
 31
31 -
 32
32 -
 33
33 -
 34
34 -
 35
35 -
 36
36 -
 37
37 -
 38
38 -
 39
39 -
 40
40 -
 41
41 -
 42
42 -
 43
43 -
 44
44 -
 45
45 -
 46
46 -
 47
47 -
 48
48 -
49
-
50
-
51
-
52
 |
 |
33
Gross Margin
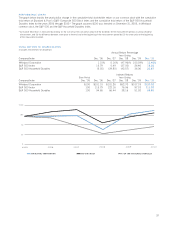
The consolidated gross margin percentage increased 0.8 points
to 14.8% compared to 2009, primarily due to cost reduction
initiatives, productivity improvements and higher BEFIEX credits
recognized, partially offset by unfavorable product price/mix and
material cost increases.
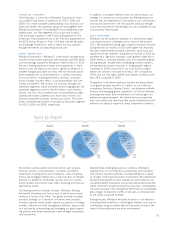
Significant regional trends were as follows:
• North America gross margin decreased compared to 2009
primarily due to unfavorable product price/mix, higher mate-
rial costs, $43 million in higher product recall charges, a
$45 million variance in LIFO adjustments from a $41 million
reduction in 2009 due to productivity driven cost deflation
to a $4 million increase in 2010 due to cost inflation, and
$18 million lower postretirement curtailment gain, partially
offset by continued cost reductions, improved productivity
and higher volumes. North America gross margin for 2009
increased compared to 2008 primarily due to continued cost
reductions and improved productivity, product price/mix and
a postretirement curtailment gain totaling $80 million. Addi-
tionally, gross margin for 2009 was positively impacted by
a $41 million reduction in LIFO reserves resulting from pro-
ductivity driven cost deflation. These gross margin improve-
ments were partially offset by the unfavorable impacts of
lower volumes, foreign currency and $35 million in charges
associated with a product recall.
• Latin America gross margin increased compared to 2009 pri-
marily due to $156 million higher BEFIEX credits recognized,
cost reductions and improved productivity, partially offset by
unfavorable product price/mix. Latin America gross margin for
2009 decreased compared to 2008 primarily due to lower
BEFIEX credits recognized, higher material and oil-related
costs, lower product price/mix and an operating tax settle-
ment, offset by improved productivity and $11 million of
credits related to refundable energy surcharges.
• Europe gross margin increased compared to 2009 primarily
due to cost reductions and improved productivity, partially
offset by unfavorable product price/mix. Europe gross margin
for 2009 decreased compared to 2008 primarily due to
lower volumes, the unfavorable impact of foreign currency,
asset sale gains and insurance proceeds totaling $14 million
recognized in 2008. These decreases were partially offset by
cost reductions and productivity initiatives and lower material
and oil-related costs.
• Asia gross margin decreased compared to 2009 primarily
due to higher material and oil-related costs and unfavorable
product price/mix, partially offset by the favorable impact of
foreign currency. Asia gross margin for 2009 increased com-
pared to 2008 primarily due to continued cost reductions and
improved productivity and a $3 million asset sale gain, which
were partially offset by unfavorable product price/mix.
Selling, General and Administrative
Selling, general and administrative expenses as a percent of
consolidated net sales decreased compared to 2009, primarily
due to favorable leverage on increased net sales. Selling, general
and administrative expenses increased approximately $54 mil-
lion compared to 2009 in Latin America, primarily due to the
unfavorable impact of foreign currency and higher infrastructure
spending to support higher sales volumes. Selling, general and
administrative expenses as a percent of consolidated net sales
for 2009 decreased compared to 2008, primarily as a result of
infrastructure cost reductions and lower brand investments.
Research and Development Costs
Research and development costs increased $27 million or 5.5%
compared to 2009 to $516 million or 2.8% of consolidated
net sales. In 2009, research and development costs increased
$26 million or 5.6% compared to 2008 to $489 million or 2.8%
of consolidated net sales. The increases in 2010 and 2009
were primarily due to increased product innovation spending.
Restructuring Costs
Restructuring initiatives resulted in charges of $74 million,
$126 million and $149 million in 2010, 2009, and 2008,
respectively, due to ongoing efforts to optimize our global oper-
ating platform. These charges consist primarily of charges to
shift refrigeration and laundry capacity within North America
and dishwasher capacity within Europe and reorganize the
salaried workforce throughout Europe.
In 2008, management committed to a workforce reduction plan
to reduce our employee base worldwide. In 2009 management
announced changes to our North American manufacturing oper-
ations which resulted in the closure of a manufacturing facility
in Evansville, Indiana in June 2010.
Interest and Sundry Income (Expense)
Interest and sundry expense increased $22 million compared to
2009 to $197 million, primarily due to higher charges relating
to the compressor plea agreements of approximately $40 million,
partially offset by the favorable impacts of foreign currency and
higher interest income. In 2009, interest and sundry expense
increased by $75 million compared to 2008 to $175 million. The
increase in 2009 was primarily due to charges incurred for a
Brazilian collection dispute and the compressor settlement agree-
ment, partially offset by the favorable impacts of foreign currency.
Interest Expense
Interest expense increased $6 million compared to 2009 to
$225 million, as 2009 benefited from an $8 million reduction
in accrued interest as a result of an operating tax settlement.
The current year also includes higher amortization of debt issu-
ance costs, partially offset by a reduction in interest expense
due to lower average debt levels and interest rates in 2010. In
2009, interest expense increased compared to 2008 primarily
due to the combination of higher interest rates and higher aver-
age debt levels, partially offset by a reduction in accrued inter-
est of $8 million as a result of entering into a special program
in Brazil to settle tax liabilities.
Income Taxes
The effective income tax rate was a benefit of 10.9%, a benefit
of 20.6% and a benefit of 81.7% in 2010, 2009 and 2008,
respectively. The reduction in tax benefit from 2009 is primarily
due to an increase in profitability, partially offset by higher
energy tax credits generated in the United States in 2010 from
the production of certain eligible energy efficient appliances and
higher BEFIEX credits recognized in Brazil. The reduction in tax
benefit from 2008 to 2009 was primarily due to an increase in
profitability, changes in dispersion of global income and the
unfavorable impact of audits and settlements in 2009.