Whirlpool 2010 Annual Report Download - page 37
Download and view the complete annual report
Please find page 37 of the 2010 Whirlpool annual report below. You can navigate through the pages in the report by either clicking on the pages listed below, or by using the keyword search tool below to find specific information within the annual report.-
 1
1 -
2
-
3
-
4
-
5
-
6
-
7
-
8
-
9
-
10
-
11
-
12
-
13
-
14
-
15
-
16
-
17
-
18
-
19
-
20
-
21
-
22
-
23
-
24
-
25
-
26
-
 27
27 -
 28
28 -
 29
29 -
 30
30 -
 31
31 -
 32
32 -
 33
33 -
 34
34 -
 35
35 -
 36
36 -
 37
37 -
 38
38 -
 39
39 -
 40
40 -
 41
41 -
 42
42 -
 43
43 -
 44
44 -
 45
45 -
 46
46 -
 47
47 -
48
-
49
-
50
-
51
-
52
 |
 |
32
RE SULT S OF OPER ATI ON S
In 2010, consolidated net sales were over $18 billion and con-
solidated net earnings available to Whirlpool were $619 million,
or $7.97 per diluted share, increasing from $328 million or
$4.34 per diluted share in 2009. These results include record
levels of cost productivity and favorable foreign currency which
more than offset unfavorable product price/mix and higher mate-
rial and oil-related costs. In addition, net earnings in 2010
includes the benefit of $225 million of BEFIEX credits recog-
nized, compared to $69 million in 2009, and the benefit of
$225 million of energy tax credits generated in the United States
from the production of certain energy efficient appliances, com-
pared to $113 million in 2009. The increase of BEFIEX credits
recognized in 2010 was the result of the expiration of a sales
tax holiday declared in 2009 by the Brazilian government on
certain appliances in our Latin America region. During this holi-
day, we monetized reduced amounts in BEFIEX credits because
our BEFIEX credits are monetized through the offset of sales
taxes due. The sales tax holiday expired on January 31, 2010.
In 2010, several significant items also affected earnings including
$93 million in antitrust settlements, compared to $56 million
in 2009, a total of $78 million in product recall charges, com-
pared to $35 million in 2009, a $53 million charge related to
a Brazilian collection dispute compared to $46 million in 2009,
and $62 million in curtailment gains related to a retiree health-
care plan, compared to $89 million in 2009. Global industry
sales growth slowed significantly in the second half compared
to the first half of the year. The overall price/mix environment
became unfavorable, particularly in North America where we
took pricing actions to match some aggressive competitive
pricing pressure. Also, material and oil-related cost increases
escalated during the second half of the year. We have recently
announced price increases in many markets to address the
material and oil-related cost increases.
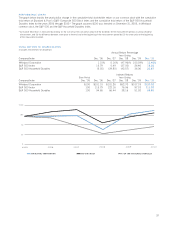
Consolidated Net Sales
Consolidated net sales increased 7.4% compared to 2009
primarily due to higher unit shipments, higher BEFIEX credits
recognized and the favorable impact of foreign currency partially
offset by unfavorable product price/mix. Excluding the impact of
foreign currency, consolidated net sales increased 5.3% com-
pared to 2009. Consolidated net sales for 2009 decreased
9.6% compared to 2008 primarily due to lower unit shipments
and the impact of unfavorable foreign currency. Excluding the
impact of foreign currency, consolidated net sales for 2009
decreased 5.8% compared to 2008.
Significant regional trends were as follows:
• North America net sales increased 2.0% compared to 2009
primarily due to a 5.9% increase in units sold. The increase
in units sold was driven by strong industry growth in the first
half which slowed significantly in the second half primarily
in the United States. In addition, net sales were negatively
impacted by unfavorable product price/mix, including pricing
actions during the second half of 2010 taken to match aggres-
sive competitive pricing pressure, partially offset by the favor-
able impact of foreign currency. Excluding the impact of
foreign currency, North America net sales increased 0.7% in
2010. North America net sales for 2009 decreased 11.0%
compared to 2008 primarily due to a 9.5% decrease in units
sold. The decline in units sold was due to decreased industry
demand resulting from continued weak economies in the
United States, Mexico and Canada in 2009. Additionally, net
sales were negatively impacted by the unfavorable impact
of foreign currency, which was partially offset by favorable
product price/mix. Excluding the impact of foreign currency,
North America net sales for 2009 decreased 9.4% compared
to 2008.
• Latin America net sales increased 26.7% compared to 2009
primarily due to a 16.1% increase in units sold. The increase
in units sold was driven by strong industry growth in the first
half which moderated somewhat in the second half of the
year. In addition, net sales increased due to the favorable
impact of foreign currency and higher BEFIEX credits rec-
ognized, partially offset by unfavorable product price/mix.
Excluding the impact of foreign currency and higher BEFIEX
credits, Latin America net sales increased 13.7% in 2010.
Latin America net sales for 2009 were unchanged compared
to 2008 as the unfavorable impact of foreign currency and
lower BEFIEX credits recognized were fully offset by a 14.5%
increase in units sold. The increase in units sold in 2009
was a result of favorable economic conditions and a sales tax
holiday in Brazil. The sales tax holiday was the primary driver
of the reduction of BEFIEX credits recognized. This sales tax
holiday was declared by the Brazilian government on certain
appliances beginning in the second quarter and extended
through the remainder of 2009. During this holiday, we
monetized reduced amounts of BEFIEX credits because our
BEFIEX credits are monetized through the offset of sales
taxes due. The sales tax holiday expired January 31, 2010.
Excluding the impact of foreign currency, Latin America net
sales for 2009 increased 7.1% compared to 2008.
We monetized $225 million, $69 million and $168 million
of BEFIEX credits during 2010, 2009 and 2008, respectively.
We expect to continue recognizing credits as they are mone-
tized. At December 31, 2010, $540 million of these export
credits remain. Future actions by the Brazilian government
could limit our ability to monetize these export credits.
• Europe net sales decreased 3.3% compared to 2009, pri-
marily due to the unfavorable impact of foreign currency
and unfavorable product price/mix driven by an increasingly
competitive pricing environment, partially offset by a 4.7%
increase in units sold due to higher industry demand, which
accelerated during the second half of 2010. Excluding the
impact of foreign currency, Europe net sales increased 0.7%.
Europe net sales for 2009 decreased 16.9% compared to
2008, primarily due to an 11.7% decrease in units sold due
to lower appliance industry demand and the unfavorable
impact of foreign currency. Excluding the impact of foreign
currency, Europe net sales for 2009 decreased 11.2% com-
pared to 2008.
• Asia net sales increased 30.6%, led by results in India and
China, compared to 2009 primarily due to a 22.4% increase
in units sold. Excluding the impact of foreign currency, Asia net
sales increased 23.8%. Asia net sales for 2009 increased
10.3% compared to 2008 primarily due to a 20.8% increase
in units sold partially offset by the impact of unfavorable for-
eign currency. Excluding the impact of foreign currency, Asia
net sales for 2009 increased 18.4% compared to 2008.