Whirlpool 2002 Annual Report Download - page 38
Download and view the complete annual report
Please find page 38 of the 2002 Whirlpool annual report below. You can navigate through the pages in the report by either clicking on the pages listed below, or by using the keyword search tool below to find specific information within the annual report.-
 1
1 -
2
-
3
-
4
-
5
-
6
-
7
-
8
-
9
-
10
-
11
-
12
-
13
-
14
-
15
-
16
-
17
-
18
-
19
-
20
-
21
-
22
-
23
-
24
-
25
-
26
-
27
-
 28
28 -
 29
29 -
 30
30 -
 31
31 -
 32
32 -
 33
33 -
 34
34 -
 35
35 -
 36
36 -
 37
37 -
 38
38 -
 39
39 -
 40
40 -
 41
41
 |
 |

7372
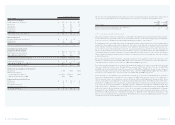
Eleven-Year Consolidated Statistical Review
Millions of dollars, except share and employee data 2002 2001 2000 1999 1998 1997 1996 1995 1994 1993 1992
Consolidated operations
Net sales $ 11,016 $ 10,343 $ 10,325 $ 10,511 $ 10,323 $ 8,617 $ 8,523 $ 8,163 $ 7,949 $ 7,368 $ 7,097
Operating profit 1692 306 807 875 688 11 278 366 370 504 447
Earnings (loss) from continuing operations before income taxes and other items 495 93 577 514 564 (171) 100 214 269 418 334
Earnings (loss) from continuing operations 262 34 367 347 310 (46) 141 195 147 257 179
Earnings (loss) from discontinued operations 2(43) (21) ––15 31 15 14 11 (28) 26
Net earnings (loss)3(394) 21 367 347 325 (15) 156 209 158 51 205
Net capital expenditures 430 378 375 437 542 378 336 483 418 309 288
Depreciation 391 368 371 386 399 322 318 282 246 241 275
Dividends 91 113 70 103 102 102 101 100 90 85 77
Consolidated financial position
Current assets 3,327 3,311 3,237 3,177 3,882 4,281 3,812 3,541 3,078 2,708 2,740
Current liabilities 3,505 3,102 3,303 2,892 3,267 3,676 4,022 3,829 2,988 2,763 2,887
Working capital (178) 209 (66) 285 615 605 (210) (288) 90 (55) (147)
Property, plant and equipment-net 2,338 2,052 2,134 2,178 2,418 2,375 1,798 1,779 1,440 1,319 1,325
Total assets 6,631 6,967 6,902 6,826 7,935 8,270 8,015 7,800 6,655 6,047 6,118
Long-term debt 1,092 1,295 795 714 1,087 1,074 955 983 885 840 1,215
Stockholders’ equity 739 1,458 1,684 1,867 2,001 1,771 1,926 1,877 1,723 1,648 1,600
Per share data
Basic earnings (loss) from continuing operations 3.86 0.51 5.24 4.61 4.09 (0.62) 1.90 2.64 1.98 3.60 2.55
Diluted earnings (loss) from continuing operations 3.78 0.50 5.20 4.56 4.06 (0.62) 1.88 2.60 1.95 3.47 2.46
Diluted net earnings (loss)3(5.68) 0.31 5.20 4.56 4.25 (0.20) 2.08 2.78 2.10 0.71 2.81
Dividends 1.36 1.36 1.36 1.36 1.36 1.36 1.36 1.36 1.22 1.19 1.10
Book value 10.67 21.44 23.84 24.55 26.16 23.71 25.93 25.40 23.21 23.17 22.91
Closing Stock Price - NYSE 52.22 73.33 47.69 65.06 55.38 55.00 46.63 53.25 50.25 66.50 44.63
Key ratios4
Operating profit margin 6.3% 3.0% 7.8% 8.3% 6.7% 0.1% 3.3% 4.5% 4.7% 6.8% 6.3%
Pre-tax margin54.5% 0.9% 5.6% 4.9% 5.5% (2.0)% 1.2% 2.6% 3.4% 5.7% 4.7%
Net margin62.4% 0.3% 3.6% 3.3% 3.0% (0.5)% 1.7% 2.4% 1.8% 3.5% 2.5%
Return on average stockholders’ equity714.8% 1.3% 20.7% 17.9% 17.2% (0.8)% 8.2% 11.6% 9.4% 14.2% 13.1%
Return on average total assets83.4% 0.4% 5.5% 4.2% 4.6% (0.7)% 1.8% 3.0% 2.8% 4.0% 3.3%
Current assets to current liabilities 0.9x 1.1x 1.0x 1.1x 1.2x 1.2x 0.9x 0.9x 1.0x 1.0x 0.9x
Total debt-appliance business as a percent of invested capital965.1% 48.0% 49.4% 37.7% 43.5% 46.1% 44.2% 45.2% 35.6% 33.8% 42.8%
Price earnings ratio –236.5x 9.2x 14.3x 13.0x –22.4x 19.2x 23.9x 21.2 x 15.9x
Interest coverage10 4.5x 1.6x 4.2x 4.1x 3.2x –1.6x 2.7x 3.6x 5.0x 3.5x
Other data
Number of common shares outstanding (in thousands):
Average – on a diluted basis 69,267 68,036 70,637 76,044 76,507 74,697 77,178 76,812 77,588 76,013 75,661
Year-end 68,226 67,215 66,265 74,463 76,089 75,262 74,415 74,081 73,845 73,068 70,027
Number of stockholders (year-end) 8,556 8,840 11,780 12,531 13,584 10,171 11,033 11,686 11,821 11,438 11,724
Number of employees (year-end) 68,272 61,923 62,527 62,706 59,885 62,419 49,254 46,546 39,671 40,071 38,902
Total return to shareholders (five year annualized)11 1.4% 12.2% 0.3% 7.9% (1.2)% 6.8% 6.3% 20.8% 12.0% 25.8% 17.0%
1 Restructuring and special operating charges were $161 million in 2002, $212 million in 2001, $405 million in 1997, $30 million in 1996, and $250 million in 1994.
2 The company’s financial services business was discontinued in 1997.
3 Includes cumulative effect of accounting changes: 2002 - Accounting for goodwill of ($613) million or ($8.84) per diluted share; 2001 - Accounting
for derivative instruments and hedging activities of $8 million or $0.12 per diluted share; 1993 - Accounting for postretirement benefits other than
pensions of ($180) million or ($2.42) per diluted share.
4 Excluding one-time charges for restructuring and related charges, a minority investment write-off in a European business, goodwill write-off of an Asian
entity, product recalls, discontinued operations and accounting changes in 2002, selected key ratios would be as follows: a) Operating profit margin -
7.9%, b) Pre-tax margin - 6.1%, c) Net margin - 3.8%, d) Return on average stockholders’ equity - 27%, e) Return on average total assets - 6.1%, and f) Interest
coverage - 6x. Excluding one-time charges for restructuring and related charges, product recalls, discontinued operations and accounting changes in
2001, selected key ratios would be as follows: a) Operating profit margin - 7.9%, b) Pre-tax margin - 5.8%, c) Net margin - 3.6%, d) Return on average
stockholders’ equity - 22%, e) Return on average total assets - 5.6%, and f) Interest coverage - 5x. Excluding the first-quarter impact of the Brazilian currency
devaluation in 1999 and the gain from discontinued operations in 1998, returns on average stockholders’ equity were 19.9% and 16.5%, and returns on
average total assets were 5.7% and 4.3%. Excluding non-recurring items, selected 1997 Key Ratios would be as follows: a) Operating profit margin - 4.7%,
b) Pre-tax margin - 2.7%, c) Net margin - 2.6%, d) Return on average stockholders’ equity - 12%, e) Return on average total assets - 2.7%, f) Interest coverage - 3x.
5 Earnings from continuing operations before income taxes and other items, as a percent of sales.
6 Earnings from continuing operations, as a percent of sales.
7 Net earnings (loss) before accounting change, divided by average stockholders’ equity.
8 Net earnings (loss) before accounting change, plus minority interest divided by average total assets.
9 Debt divided by debt, stockholders’ equity and minority interests.
10 Ratio of earnings from continuing operations (before income taxes, accounting change and interest expense) to interest expense.
11 Stock appreciation plus reinvested dividends.