Whirlpool 2002 Annual Report Download - page 35
Download and view the complete annual report
Please find page 35 of the 2002 Whirlpool annual report below. You can navigate through the pages in the report by either clicking on the pages listed below, or by using the keyword search tool below to find specific information within the annual report.-
 1
1 -
2
-
3
-
4
-
5
-
6
-
7
-
8
-
9
-
10
-
11
-
12
-
13
-
14
-
15
-
16
-
17
-
18
-
19
-
20
-
21
-
22
-
23
-
24
-
 25
25 -
 26
26 -
 27
27 -
 28
28 -
 29
29 -
 30
30 -
 31
31 -
 32
32 -
 33
33 -
 34
34 -
 35
35 -
 36
36 -
 37
37 -
 38
38 -
 39
39 -
 40
40 -
 41
41
 |
 |

2002 Annual Report 67
Notes to Consolidated Financial Statements
66
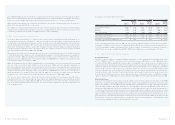
Postretirement Medical Benefits
Millions of dollars 2002 2001 2000
Change in benefit obligation
Benefit obligation as of January 1 $ 525 $ 439 $ 414
Service cost 14 11 9
Interest cost 41 34 32
Amendments (9) (43) –
Actuarial loss 123 108 6
Benefits paid (39) (24) (22)
Benefit obligation as of December 31 $ 655 $ 525 $ 439
Change in plan assets
Fair value of plan assets as of January 1 $ – $ – $ –
Contributions 39 24 22
Benefits paid (39) (24) (22)
Fair value of plan assets as of December 31 $ – $ – $ –
Reconciliation of prepaid (accrued)
cost and total amount recognized
Funded status as of December 31 $ (655) $ (525) $ (439)
Unrecognized actuarial (gain) loss 215 87 (21)
Unrecognized prior service cost (47) (43) –
Prepaid (accrued) cost as of December 31 $ (487) $ (481) $ (460)
Prepaid cost at December 31 $ – $ – $ –
Accrued benefit liability at December 31 (487) (481) (460)
Total recognized as of December 31 $ (487) $ (481) $ (460)
Weighted average assumptions as of December 31
Discount rate 6.75% 7.50% 8.00%
Medical costs trend rate:
For year ending December 31 9.5-10.5% 8.5-10.5% 6.00%
Ultimate medical trend rate (2006) 5.50% 6.00%
Components of net periodic benefit cost
Service cost $14$11$ 9
Interest cost 41 34 32
Recognized actuarial loss 5 ––
Amortization of prior service cost (4) ––
Net periodic benefit cost $ 56 $ 45 $ 41
The medical cost trend significantly affects the reported postretirement benefit cost and benefit obligations. A
one-percentage-point change in the assumed health care cost trend rate would have the following effects:
One One
Percentage Percentage
Point Point
Millions of dollars Increase Decrease
Effect on total service cost and interest cost components $ 1 $ (2)
Effect on postretirement benefit obligation 17 (19)
>17 BUSINESS SEGMENT INFORMATION
Operating segments are defined as components of an enterprise about which separate financial information is available
that is evaluated on a regular basis by the chief operating decision maker, or decision making group, in deciding how
to allocate resources to an individual segment and in assessing performance of the segment.
The company identifies such segments based upon geographical regions of operations because each operating segment
manufactures home appliances and related components, but serves strategically different markets. The chief operating
decision maker evaluates performance based upon each segment’s operating income, which is defined as income
before interest income and sundry, interest expense, taxes, minority interests, and before one-time charges. Total
assets by segment are those assets directly associated with the respective operating activities. The “Other/Elimination”
column primarily includes corporate expenses, assets and eliminations, as well as all other one-time charges. Intersegment
sales are eliminated within each region with the exception of compressor sales out of Latin America, which are included
in Other/Eliminations.
Sales activity with Sears, Roebuck and Co., a North American major home appliance retailer, represented 21%, 21%
and 20% of consolidated net sales in 2002, 2001, 2000, respectively. Related receivables were 23%, 25% and 22% of
consolidated trade receivables as of December 31, 2002, 2001 and 2000, respectively.
The company conducts business in two countries that individually comprised over 10% of consolidated net sales and
total assets within the last three years. The United States represented 59%, 59%, and 55% of net sales for 2002, 2001
and 2000, respectively, while Brazil totaled 8%, 9% and 11% for 2002, 2001 and 2000, respectively. As a percentage of
total assets, the United States accounted for 40%, 44% and 41% at the end of 2002, 2001 and 2000, respectively. Brazil
accounted for 11%, 14% and 18% of total assets at the end of 2002, 2001 and 2000, respectively.
As described above, the company’s chief operating decision maker reviews each operating segment’s performance
based upon operating income excluding one-time charges. In 2002, these one-time charges were comprised of
restructuring and other related charges, product recall charges and goodwill impairment charges in Asia. These
charges are included in operating profit on a consolidated basis and included in the Other/Eliminations column in the
tables below. For 2002 year-to-date amounts, the operating segments recorded total restructuring and related charges
(refer to Note 13) as follows: North America – $43 million, Europe – $79 million, Latin America – $24 million, Asia – $11
million and Corporate – $4 million, for a total of $161 million. Also included in Other/Eliminations during 2002 is $9
million of product recall related charges (refer to Note 14) recorded in the fourth quarter and $9 million in goodwill
impairment charges. In 2001, the operating segments recorded total restructuring and related charges as follows:
North America – $35 million, Europe – $92 million, Latin America – $68 million, Asia – $13 million and Corporate – $4
million for a total of $212 million. Also included in the Other/Eliminations column during 2001 is $295 million of product
recall charges related to the North American region.