Whirlpool 2002 Annual Report Download - page 18
Download and view the complete annual report
Please find page 18 of the 2002 Whirlpool annual report below. You can navigate through the pages in the report by either clicking on the pages listed below, or by using the keyword search tool below to find specific information within the annual report.-
 1
1 -
2
-
3
-
4
-
5
-
6
-
7
-
 8
8 -
 9
9 -
 10
10 -
 11
11 -
 12
12 -
 13
13 -
 14
14 -
 15
15 -
 16
16 -
 17
17 -
 18
18 -
 19
19 -
 20
20 -
 21
21 -
 22
22 -
 23
23 -
 24
24 -
 25
25 -
 26
26 -
 27
27 -
 28
28 -
29
-
30
-
31
-
32
-
33
-
34
-
35
-
36
-
37
-
38
-
39
-
40
-
41
 |
 |

2002 Annual Report 33
Management’s Discussion and Analysis
32
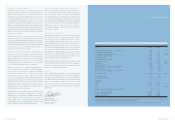
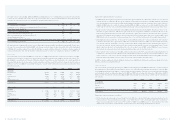
The table below reconciles 2002, 2001 and 2000 net earnings (loss) to core earnings from operations. The adjustments
to arrive at core earnings from operations are presented in the table on an after-tax and minority interests basis and
reference the related notes to the accompanying consolidated financial statements:
Millions of dollars 2002 2001 2000
Net earnings (loss) – U.S. GAAP $ (394) $ 21 $ 367
Cumulative effect of changes in accounting principle (Notes 1 and 3) 613 (8) -
Discontinued operations (Note 5) 43 21 -
Earnings from continuing operations 262 34 367
Restructuring and related charges (Note 13) 121 156 -
Write-off of equity interest and advances (Note 7) 22 - -
Goodwill impairment (Note 3) 9 - -
Product recall related charges (Note 14) 6 181 -
Core earnings from operations $ 420 $ 371 $ 367
We expect that the company will continue to face challenging economic conditions worldwide during 2003. Despite this,
we expect to see moderate growth during 2003, reflecting an accelerated pace of innovation and continued strengthening
of Whirlpool brands throughout the world. We will also recognize additional benefits from the recently completed
restructuring initiative and other productivity efforts. As a result, we expect to see improved earnings over 2002 levels.
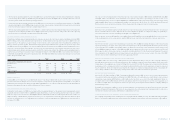
NET SALES
The total number of units sold in 2002 increased 7.8% over 2001. Consolidated net sales increased 6.5% over 2001,
which includes a negative impact from currency fluctuations. Excluding currency impact, net sales increased 7.3%.
Excluding the acquisitions of Vitromatic (Whirlpool Mexico) and Polar, as described in Note 4 to the Consolidated
Financial Statements, the total number of units and dollars sold increased 4.6% and 4.2%, respectively. Net sales in
2001 were up 3% over 2000 after excluding the impact of currency. The tables below provide the breakdown of units
and sales by region.
In thousands 2002 Change 2001 Change 2000
Units Sold:
North America 24,324 13.6% 21,404 3.7% 20,634
Europe 11,024 2.0 10,803 (0.7) 10,876
Latin America 4,386 (7.4) 4,738 (3.7) 4,918
Asia 2,279 11.2 2,050 4.7 1,958
Other/eliminations (31) –(36) –(31)
Consolidated 41,982 7.8% 38,959 1.6% 38,355
Millions of dollars 2002 Change 2001 Change 2000
Net Sales:
North America $ 7,306 11.0% $ 6,581 5.8% $ 6,223
Europe 2,199 6.9 2,058 (4.5) 2,156
Latin America 1,266 (14.9) 1,487 (12.8) 1,706
Asia 391 4.8 373 (4.4) 390
Other/eliminations (146) –(156) –(150)
Consolidated $ 11,016 6.5% $ 10,343 0.2% $ 10,325
Significant regional trends were as follows:
> In 2002, North American unit volumes increased 13.6%. Approximately one-third of the volume increase resulted
from the inclusion of Whirlpool Mexico in the company’s consolidated results since July 2002, when the remaining
51% ownership interest was acquired. While the North American industry was up, our market share in the region fell
slightly in 2002 from its record levels achieved during 2001. In 2002, net sales increased by slightly less than unit
volumes as the current year’s acquisition combined with competitive pricing pressures reduced average sales values.
> European unit volumes increased 2.0% versus 2001 in an industry that was down slightly. The increase is due to the
inclusion of sales from Polar, which we acquired in the second quarter of 2002 as described in Note 4 to the
Consolidated Financial Statements. Net sales increased by a larger percentage due primarily to positive currency
fluctuations. Excluding currency impact, net sales increased 1.7%. European unit volumes were down in 2001 versus
2000 and net sales decreased by a larger percentage due to currency fluctuations and continued pricing pressures.
> Unit shipments in Latin America decreased 7.4% versus 2001 due primarily to political instability and economic
volatility in the region. The region’s sales, which were down 14.9% compared to 2001, were also heavily affected by
currency fluctuations, including a currency devaluation in Brazil of approximately 35%. Excluding the impact of
currency fluctuations, net sales decreased 3.9%, which was less than the decrease in units shipped due to some
improvements in product mix and pricing. Net sales were also lower in 2001 versus 2000 due to an economic
slowdown in the region, an energy crisis in Brazil and Argentina, and currency fluctuations.
> Asia’s unit sales increased 11.2% over 2001, while net sales increased by 4.8% as product mix and pricing pressures
combined to reduce the benefit of higher volumes. Excluding currency fluctuations, net sales increased 5.2%. The
region continues to experience increased shipments in both the India and China markets. During 2001, Asia also
posted growth in units shipped, but net sales were hurt by currency and product mix issues.
In 2003, we believe appliance industry shipments will increase slightly in North America and Asia, remain flat in Latin
America, and decrease slightly in Europe.
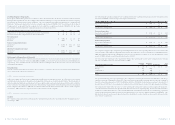
GROSS MARGIN
The consolidated gross margin percentage in 2002 decreased slightly versus 2001 due primarily to continued global
pricing pressures offsetting productivity improvements. The consolidated gross margin percentage declined in 2001
versus 2000 due primarily to the impact of restructuring and related charges. The table below outlines the gross margin
percentages by region, excluding the impact of the 2002 and 2001 restructuring related charges of $43 million and $53
million from the regional percentages. The 2002 and 2001 restructuring related charges are included in the consolidated
percentages.
2002 Change 2001 Change 2000
Gross Margin
North America 23.6% 0.1pts 23.5% (0.8)pts 24.3%
Europe 22.2 0.9 21.3 (2.0) 23.3
Latin America 23.4 (2.6) 26.0 3.1 22.9
Asia 23.7 (2.5) 26.2 0.1 26.1
Consolidated 23.2% (0.2)pts 23.4% (0.7)pts 24.1%
Significant regional trends were as follows:
> North American gross margin increased slightly versus 2001 due to productivity improvements partially offset by
lower pension credits and increased warranty costs. This increase came on sharply higher sales resulting in
improved operating profit for the region. The decline in 2001 versus 2000 was due to unfavorable product and
channel mix, lower pension credits and increased warranty costs offsetting productivity improvements.