Whirlpool 2002 Annual Report Download - page 24
Download and view the complete annual report
Please find page 24 of the 2002 Whirlpool annual report below. You can navigate through the pages in the report by either clicking on the pages listed below, or by using the keyword search tool below to find specific information within the annual report.-
 1
1 -
2
-
3
-
4
-
5
-
6
-
7
-
8
-
9
-
10
-
11
-
12
-
13
-
 14
14 -
 15
15 -
 16
16 -
 17
17 -
 18
18 -
 19
19 -
 20
20 -
 21
21 -
 22
22 -
 23
23 -
 24
24 -
 25
25 -
 26
26 -
 27
27 -
 28
28 -
 29
29 -
 30
30 -
 31
31 -
 32
32 -
 33
33 -
 34
34 -
35
-
36
-
37
-
38
-
39
-
40
-
41
 |
 |

2002 Annual Report 45
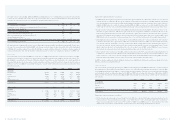
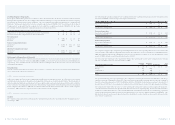
Consolidated Statements of Cash Flows
44
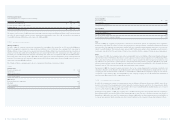
Consolidated Statements of Changes in Stockholders’ EquityConsolidated Statements of Cash Flows
Year ended December 31 –Millions of dollars 2002 2001 2000
Operating activities
Net earnings (loss) $ (394) $ 21 $ 367
Adjustments to reconcile net earnings (loss) to net cash
provided by operating activities:
Cumulative effect of a change in accounting principle 613 (8) –
Equity in earnings (losses) of affiliated companies,
less dividends received 27 4 (3)
Loss on disposition of assets 32 33 15
Loss on discontinued operations 43 21 –
Depreciation and amortization 405 396 400
Changes in assets and liabilities, net of business acquisitions:
Trade receivables (67) 116 (348)
Inventories 101 (26) (80)
Accounts payable 63 230 221
Product recalls (239) 239 –
Restructuring charges, net of cash paid 33 74 (43)
Taxes deferred and payable, net 157 (129) 11
Tax paid on cross currency interest rate swap gain (86) ––
Other – net 124 53 (95)
Cash Provided by Operating Activities $ 812 $ 1,024 $ 445
Investing activities
Capital expenditures $ (430) $ (378) $ (375)
Acquisitions of businesses, less cash acquired (179) –(283)
Proceeds of cross-currency interest rate swaps –209 –
Cash Used for Investing Activities $ (609) $ (169) $ (658)
Financing activities
Net proceeds (repayments) of short-term borrowings $ (165) $ (790) $ 628
Proceeds of long-term debt 6 301 326
Repayments of long-term debt (30) (80) (408)
Dividends paid (91) (113) (70)
Purchase of treasury stock (46) (43) (427)
Other – net 37227
Cash Provided by (used for) Financing Activities $ (323) $ (653) $ 76
Effect of Exchange Rate Changes on Cash and Equivalents $ (4) $ –$ (10)
Increase (Decrease) in Cash and Equivalents $ (124) $ 202 $ (147)
Cash and Equivalents at Beginning of Year 316 114 261
Cash and Equivalents at End of Year $ 192 $ 316 $ 114
See notes to consolidated financial statements
Treasury Accumulated
Stock/ Other
Common Paid-in Comprehensive Retained
Millions of dollars Stock Capital Income Earnings Total
Balances, January 1, 2000 $ 84 $ (42) $ (443) $ 2,268 $ 1,867
Comprehensive income
Net earnings 367 367
Minimum pension liability adjustments, net of tax of $4 (5) (5)
Foreign currency items, net of tax of $15 (47) (47)
Comprehensive income 315
Common stock repurchased (427) (427)
Common stock issued 25 25
Dividends declared on common stock (96) (96)
Balances, December 31, 2000 $ 84 $ (444) $ (495) $ 2,539 $ 1,684
Comprehensive loss
Net earnings 21 21
Cumulative effect of change
in accounting principle, net of tax of $7 (11) (11)
Unrealized loss on
derivative financial instruments, net of tax of $2 (6) (6)
Minimum pension liability adjustments, net of tax of $4 (7) (7)
Foreign currency items, net of tax of $3 (178) (178)
Comprehensive loss (181)
Common stock repurchased (43) (43)
Common stock issued 2 86 88
Dividends declared on common stock (90) (90)
Balances, December 31, 2001 $ 86 $ (401) $ (697) $ 2,470 $ 1,458
Comprehensive loss
Net loss (394) (394)
Unrealized loss on derivative financial instruments (3) (3)
Minimum pension liability adjustments, net of tax of $100 (151) (151)
Foreign currency items (148) (148)
Comprehensive loss (696)
Common stock repurchased, net of reissuances (35) (35)
Common stock issued 1 102 103
Dividends declared on common stock (91) (91)
Balances, December 31, 2002 $ 87 $ (334) $ (999) $ 1,985 $ 739
See notes to consolidated financial statements