Whirlpool 2002 Annual Report Download - page 36
Download and view the complete annual report
Please find page 36 of the 2002 Whirlpool annual report below. You can navigate through the pages in the report by either clicking on the pages listed below, or by using the keyword search tool below to find specific information within the annual report.-
 1
1 -
2
-
3
-
4
-
5
-
6
-
7
-
8
-
9
-
10
-
11
-
12
-
13
-
14
-
15
-
16
-
17
-
18
-
19
-
20
-
21
-
22
-
23
-
24
-
25
-
 26
26 -
 27
27 -
 28
28 -
 29
29 -
 30
30 -
 31
31 -
 32
32 -
 33
33 -
 34
34 -
 35
35 -
 36
36 -
 37
37 -
 38
38 -
 39
39 -
 40
40 -
 41
41
 |
 |

2002 Annual Report 69
Notes to Consolidated Financial Statements
68
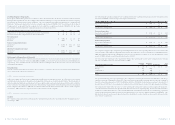
Geographic Segments
North Latin Other/ Total
Millions of dollars America Europe America Asia Eliminations Whirlpool
Net sales
2002 $ 7,306 $ 2,199 $ 1,266 $ 391 $ (146) $ 11,016
2001 6,581 2,058 1,487 373 (156) 10,343
2000 6,223 2,156 1,706 390 (150) 10,325
Intangible amortization
2002 $ – $ – $ – $ – $14$14
2001 3 1335428
2000 3 1335529
Depreciation
2002 $ 197 $ 83 $ 80 $ 16 $ 15 $ 391
2001 173 78 91 15 11 368
2000 157 74 106 17 17 371
Operating profit (loss)
2002 $ 830 $ 81 $ 107 $ 14 $ (340) $ 692
2001 758 39 134 19 (644) 306
2000 682 102 125 21 (123) 807
Total assets
2002 $ 2,913 $ 2,015 $ 1,054 $ 516 $ 133 $ 6,631
2001 2,591 2,067 1,339 653 317 6,967
2000 2,624 1,948 1,600 704 26 6,902
Capital expenditures
2002 $ 165 $ 103 $ 112 $ 15 $ 35 $ 430
2001 191 87 80 10 10 378
2000 175 94 86 10 10 375
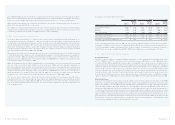
>18 QUARTERLY RESULTS OF OPERATIONS (UNAUDITED)
Three Months Ended
Restated
Millions of dollars, except per share data Dec. 31 Sept. 30 Jun. 30 Mar. 31
2002
Net sales $ 2,947 $ 2,759 $ 2,737 $ 2,574
Cost of products sold 2,266 2,114 2,103 1,982
Earnings from continuing operations 14 101 63 84
Net earnings (loss) (29) 101 63 (529)
Per share of common stock
Basic earnings from continuing operations $ 0.20 $ 1.48 $ 0.93 $ 1.25
Basic net earnings (loss) (0.43) 1.48 0.93 (7.86)
Diluted earnings from continuing operations $ 0.20 $ 1.46 $ 0.91 $ 1.21
Diluted net earnings (loss) (0.42) 1.46 0.91 (7.63)
Dividends $ 0.34 $ 0.34 $ 0.34 $ 0.34
Significant after-tax items included in the quarterly net earnings (loss):
Restructuring and related charges (Note 13) $ (84) $ (11) $ (19) $ (8)
Impairment charge related to minority investment (Note 7) ––(22) –
Goodwill write-off of an Asian entity (Note 3) (9) –––
Product recalls (Note 14) (6) –––
Discontinued operations (Note 5) (43) –––
Cumulative effect of a change in accounting principle (Note 3) –––(613)
The net loss (and related per share amounts) for the restated first quarter as shown above differ from the originally filed
amounts due to the adoption of SFAS No. 142, as discussed in Note 3.
Three Months Ended
Millions of dollars, except per share data Dec. 31 Sept. 30 Jun. 30 Mar. 31
2001
Net sales $ 2,647 $ 2,594 $ 2,585 $ 2,517
Cost of products sold 1,989 1,988 1,989 1,959
Earnings (loss) from continuing operations 21 (94) 74 33
Net earnings (loss) 21 (94) 53 41
Per share of common stock
Basic earnings (loss) from continuing operations $ 0.31 $ (1.40) $ 1.12 $ 0.49
Basic net earnings (loss) 0.31 (1.40) 0.80 0.62
Diluted earnings (loss) from continuing operations $ 0.31 $ (1.40) $ 1.10 $ 0.49
Diluted net earnings (loss) 0.31 (1.40) 0.78 0.61
Dividends $ 0.34 $ 0.34 $ 0.34 $ 0.34
Significant after-tax items included in the quarterly net earnings (loss):
Restructuring and related charges (Note 13) $ (91) $ (11) $ (14) $ (40)
Product recalls (Note 14) 3 (184) ––
Discontinued operations (Note 5) ––(21) –
Cumulative effect of a change in accounting principle (Note 1) –––8