Tyson Foods 2002 Annual Report Download - page 47
Download and view the complete annual report
Please find page 47 of the 2002 Tyson Foods annual report below. You can navigate through the pages in the report by either clicking on the pages listed below, or by using the keyword search tool below to find specific information within the annual report.-
 1
1 -
2
-
3
-
4
-
5
-
6
-
7
-
8
-
9
-
10
-
11
-
12
-
13
-
14
-
15
-
16
-
17
-
18
-
19
-
20
-
21
-
22
-
23
-
24
-
25
-
26
-
27
-
28
-
29
-
30
-
31
-
32
-
33
-
34
-
35
-
36
-
 37
37 -
 38
38 -
 39
39 -
 40
40 -
 41
41 -
 42
42 -
 43
43 -
 44
44 -
 45
45 -
 46
46 -
 47
47 -
 48
48 -
 49
49 -
 50
50 -
 51
51 -
 52
52 -
 53
53 -
 54
54 -
 55
55 -
 56
56 -
 57
57 -
58
-
59
-
60
-
61
-
62
-
63
 |
 |

notes to
consolidated
financial
statements
p 45
In May 2000, the Company cancelled approximately four million option shares and granted approximately one million restricted
shares of Class A stock. The restriction expires over periods through December 1, 2003. At September 28, 2002, the Company
had outstanding approximately six million restricted shares of Class A stock with restrictions expiring over periods through July 1,
2020. The unearned portion of the restricted stock is classified on the Consolidated Balance Sheets as deferred compensation in
shareholders’ equity.
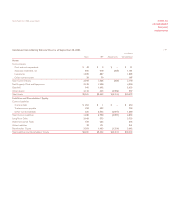
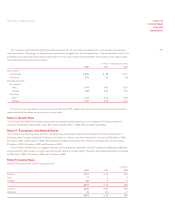
A summary of the Company’s stock option activity is as follows:
Weighted average
Shares under exercise price
option per share
Outstanding, October 2, 1999 12,086,332 $15.74
Exercised (88,332) 14.23
Cancelled (5,199,995) 15.17
Outstanding, September 30, 2000 6,798,005 16.19
Exercised ––
Cancelled (689,520) 15.57
Granted 4,291,650 11.50
Options assumed with IBP acquisition 5,918,068 8.70
Outstanding, September 29, 2001 16,318,203 12.27
Exercised
(800,596) 9.50
Cancelled
(997,816) 12.97
Granted
2,509,695 9.45
Outstanding, September 28, 2002
17,029,486 $12.01
The number of options exercisable was as follows: September 28, 2002 –9,373,360; September 29, 2001–9,644,323 and
September 30, 2000 –2,926,980. The remainder of the options outstanding at September 28, 2002, are exercisable ratably through
October 2006. The number of shares available for future grants was 10,536,763 and 2,742,800 at September 28, 2002, and
September 29, 2001, respectively.
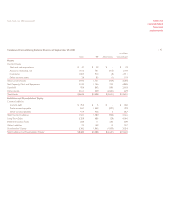
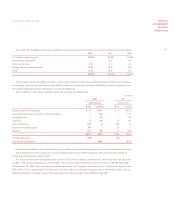
The following table summarizes information about stock options outstanding at September 28, 2002:
Options outstanding Options exercisable
Range of Shares Weighted average remaining Weighted average Shares Weighted average
exercise prices outstanding contractual life (in years) exercise price exercisable exercise price
$ 3.43 –6.69
899,540 5.9 $ 5.46 899,540 $ 5.46
6.71 –10.91
3,876,085 5.1 9.34 3,876,085 9.34
10.92 –13.85
276,240 5.7 11.69 276,240 11.69
9.32 –9.75
2,193,531 9.0 9.34 4,635 9.32
11.50
4,050,485 8.5 11.50 – –
14.33 –14.50
1,740,705 1.9 14.40 1,740,705 14.40
14.58 –15.17
1,228,000 4.0 15.04 966,315 15.04
17.92 –18.00
2,764,900 4.1 17.93 1,609,840 17.92
17,029,486 9,373,360
The weighted average fair value of options granted during 2002 was approximately $3.31. The fair value of each option grant is
established on the date of grant using the Black-Scholes option-pricing model. Assumptions include an expected life of six years, risk-free
interest rate ranging from 3.73% to 3.80%, expected volatility of 37.5% and dividend yield ranging from 1.64% to 1.72% in 2002.
Tyson Foods, Inc. 2002 annual report