Tyson Foods 2002 Annual Report Download - page 24
Download and view the complete annual report
Please find page 24 of the 2002 Tyson Foods annual report below. You can navigate through the pages in the report by either clicking on the pages listed below, or by using the keyword search tool below to find specific information within the annual report.-
 1
1 -
2
-
3
-
4
-
5
-
6
-
7
-
8
-
9
-
10
-
11
-
12
-
13
-
 14
14 -
 15
15 -
 16
16 -
 17
17 -
 18
18 -
 19
19 -
 20
20 -
 21
21 -
 22
22 -
 23
23 -
 24
24 -
 25
25 -
 26
26 -
 27
27 -
 28
28 -
 29
29 -
 30
30 -
 31
31 -
 32
32 -
 33
33 -
 34
34 -
35
-
36
-
37
-
38
-
39
-
40
-
41
-
42
-
43
-
44
-
45
-
46
-
47
-
48
-
49
-
50
-
51
-
52
-
53
-
54
-
55
-
56
-
57
-
58
-
59
-
60
-
61
-
62
-
63
 |
 |

management’s
discussion
and analysis
p 22
in millions
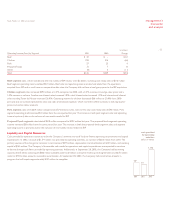
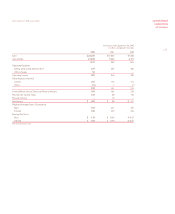
Operating Income (Loss) by Segment 2001 2000 Change
Beef $ 32 $ – $ 32
Chicken 250 316 (66)
Pork 27 23 4
Prepared Foods 15 7 8
Other (8) 3 (11)
Total $316 $349 $(33)
Beef segment sales, which include only the nine weeks of IBP results, were $2 billion, including case-ready sales of $116 million.
Beef segment operating income totaled $32 million. Beef sales and operating income are derived solely from the operations
acquired from IBP, and as such have no comparative data since the Company did not have a beef group prior to the IBP acquisition.
Chicken segment sales increased $290 million or 4.3% compared to 2000, with a 3.2% increase in average sales prices and a
1.0% increase in volume. Foodservice channel sales increased 1.0%, retail channel sales increased 1.2% and international channel
sales including Tyson de Mexico increased 26.9%. Operating income for chicken decreased $66 million or 20.9% from 2000
primarily due to increased production costs and sales promotional expenses which more than offset increases in bulk leg quarter
prices and certain other products.
Pork segment sales were $619 million compared to $157 million last year, with current year case-ready sales of $43 million. Pork
segment operating profit increased $4 million from the same period last year. The increase in both pork segment sales and operating
income is primarily due to the inclusion of nine weeks results for IBP.
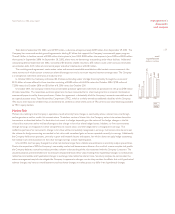
Prepared Foods segment sales totaled $818 million compared to $292 million last year. The prepared foods segment operating
income increased $8 million from the same period last year. The increase in both the prepared foods segment sales and segment
operating income is primarily due to the inclusion of nine weeks results related to IBP.
Liquidity and Capital Resources
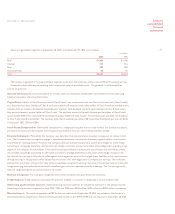
Cash provided by operations continues to be the Company’s primary source of funds to finance operating requirements and capital
expenditures. In 2002, net cash of $1,174 million was provided by operating activities, an increase of $663 million from 2001. The
primary sources of the change are increases in net income of $295 million, depreciation and amortization of $132 million, and working
capital of $165 million. The Company’s foreseeable cash needs for operations and capital expenditures are expected to continue
to be met through cash flows provided by operating activities. Additionally, at September 28, 2002, the Company had borrowing
capacity of $1.5 billion consisting of $806 million available under its $1 billion unsecured revolving credit agreements and $675 million
under its $750 million accounts receivable securitization. At September 28, 2002, the Company had construction projects in
progress that will require approximately $137 million to complete.
Tyson Foods, Inc. 2002 annual report
587 511
1,174
2000 2001 2002
cash provided
by operating
activities
dollars in millions