Tyson Foods 2002 Annual Report Download - page 46
Download and view the complete annual report
Please find page 46 of the 2002 Tyson Foods annual report below. You can navigate through the pages in the report by either clicking on the pages listed below, or by using the keyword search tool below to find specific information within the annual report.-
 1
1 -
2
-
3
-
4
-
5
-
6
-
7
-
8
-
9
-
10
-
11
-
12
-
13
-
14
-
15
-
16
-
17
-
18
-
19
-
20
-
21
-
22
-
23
-
24
-
25
-
26
-
27
-
28
-
29
-
30
-
31
-
32
-
33
-
34
-
35
-
 36
36 -
 37
37 -
 38
38 -
 39
39 -
 40
40 -
 41
41 -
 42
42 -
 43
43 -
 44
44 -
 45
45 -
 46
46 -
 47
47 -
 48
48 -
 49
49 -
 50
50 -
 51
51 -
 52
52 -
 53
53 -
 54
54 -
 55
55 -
 56
56 -
57
-
58
-
59
-
60
-
61
-
62
-
63
 |
 |

notes to
consolidated
financial
statements
p 44
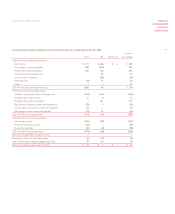
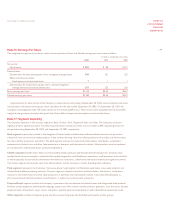
Condensed Consolidating Statement of Cash Flows for year ended September 29, 2001
in millions
Tyson IBP Adjustments Consolidated
Cash Flows From Operating Activities:
Net income $ 70 $ 18 $ –$88
Net changes in working capital 130 (14) 116
Depreciation and amortization 303 32 335
Deferred taxes (73) 26 (47)
Other 4 15 19
Cash Provided by Operating Activities 434 77 511
Cash Flows From Investing Activities:
Additions to property, plant and equipment (214) (47) (261)
Proceeds from sale of assets 32 1 33
Net cash paid for IBP acquisition (1,707) 37 (1,670)
Purchase of Tyson de Mexico minority interest (19) –(19)
Net change in other assets and liabilities (95) (6) (101)
Cash Used for Investing Activities (2,003) (15) (2,018)
Cash Flows From Financing Activities:
Net change in debt 1,656 (72) 1,584
Purchase of treasury shares (48) –(48)
Proceeds from exercise of IBP stock options –34 34
Dividends and other (34) (1) (35)
Cash Provided by (Used for) Financing Activities 1,574 (39) 1,535
Effect of Exchange Rate Change on Cash (1) –(1)
Increase in Cash and Cash Equivalents 4 23 27
Cash and Cash Equivalents at Beginning of Year 43 –43
Cash and Cash Equivalents at End of Year $ 47 $ 23 $ –$70
Note 11: Comprehensive Income (Loss)
The components of accumulated other comprehensive income (loss) included: foreign currency translation adjustment of $(23) million,
$(16) million, and $(5) million for 2002, 2001, and 2000, respectively; unrealized hedging gains (losses), net of taxes, of $(18) million,
$(21) million, and $0 for 2002, 2001, and 2000, respectively; unrealized gain (loss) on investments, net of taxes, of $0, $2 million and $0
for 2002, 2001, and 2000, respectively; and minimum pension liability adjustment, net of taxes, of $(8) million for 2002.
Note 12: Stock Options and Restricted Stock
The shareholders approved the 2000 Stock Incentive Plan (Incentive Plan) in January 2001. The Incentive Plan is administered by
the Compensation Subcommittee of the Board of Directors and permits awards of shares of Class A stock, awards of derivative
securities related to the value of Class A stock and tax reimbursement payments to eligible persons. The Incentive Plan provides
for the award of a variety of equity-based incentives such as incentive stock options, nonqualified stock options, stock appreciation
rights, dividend equivalent rights, performance unit awards and phantom shares. The Incentive Plan provides for granting incentive
stock options for shares of Class A stock at a price not less than the fair market value at the date of grant. Nonqualified stock
options may be granted at a price equal to, less than or more than the fair market value of Class A stock on the date that the option
is granted. Stock options under the Incentive Plan generally become exercisable ratably over three to eight years from the date of
grant and must be exercised within 10 years from the date of grant.
Tyson Foods, Inc. 2002 annual report