Tyson Foods 2002 Annual Report Download - page 21
Download and view the complete annual report
Please find page 21 of the 2002 Tyson Foods annual report below. You can navigate through the pages in the report by either clicking on the pages listed below, or by using the keyword search tool below to find specific information within the annual report.-
 1
1 -
2
-
3
-
4
-
5
-
6
-
7
-
8
-
9
-
10
-
 11
11 -
 12
12 -
 13
13 -
 14
14 -
 15
15 -
 16
16 -
 17
17 -
 18
18 -
 19
19 -
 20
20 -
 21
21 -
 22
22 -
 23
23 -
 24
24 -
 25
25 -
 26
26 -
 27
27 -
 28
28 -
 29
29 -
 30
30 -
 31
31 -
32
-
33
-
34
-
35
-
36
-
37
-
38
-
39
-
40
-
41
-
42
-
43
-
44
-
45
-
46
-
47
-
48
-
49
-
50
-
51
-
52
-
53
-
54
-
55
-
56
-
57
-
58
-
59
-
60
-
61
-
62
-
63
 |
 |

management’s
discussion
and analysis
p 19
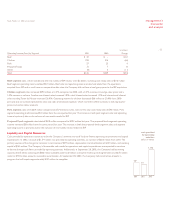
The effective tax rate was 35.5% in 2002 compared to 35.4% in 2001. The Company adopted SFAS No. 142, “Goodwill and
Other Intangible Assets” (SFAS142), at the beginning of 2002. Under SFAS 142 the Company no longer amortized goodwill which
resulted in a decrease in the effective tax rate for 2002, offset primarily by a reduction in the foreign sales benefit.
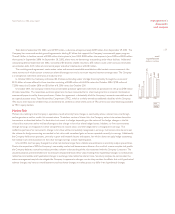
Segment Information
Tyson Foods operates in five business segments: Beef, Chicken, Pork, Prepared Foods and Other. The Company measures segment
profit as operating income. For the periods ending September 28, 2002, and September 29, 2001, the following information includes
100% of IBP results for 52 weeks and nine weeks, respectively. Information on segments is as follows.
Beef segment is primarily involved in the slaughter of live fed cattle and fabrication of dressed beef carcasses into primal and
sub-primal meat cuts and case-ready products. It also involves deriving value from allied products such as hides and variety meats
for sale to further processors and others. The beef segment markets its products to food retailers, distributors, wholesalers,
restaurants and hotel chains and other food processors in domestic and international markets. Allied products are also marketed
to manufacturers of pharmaceuticals and technical products.
Chicken segment includes fresh, frozen and value-added chicken products sold through domestic foodservice, domestic
retail markets for at-home consumption, wholesale club markets targeted to small foodservice operations, small businesses
and individuals, as well as specialty and commodity distributors who deliver to restaurants, schools and international markets
throughout the world. The chicken segment also includes sales from allied products and the chicken breeding stock subsidiary.
Pork segment represents the Company’s live swine group, hog slaughter and fabrication operations, case-ready products and
related allied product processing activities. The pork segment markets its products to food retailers, distributors, wholesalers,
restaurants and hotel chains and other food processors in domestic and international markets. It also sells allied products to
pharmaceutical and technical products manufacturers, as well as live swine to pork processors and producers.
Prepared Foods segment includes the Company’s operations that manufacture and market frozen and refrigerated food products.
Products include pepperoni, beef and pork toppings, pizza crusts, flour and corn tortilla products, appetizers, hors d’oeuvres, desserts,
prepared meals, ethnic foods, soups, sauces, side dishes, specialty pasta and meat dishes as well as branded and processed meats.
Other segment includes the logistics group and other corporate groups not identified with specific protein groups.
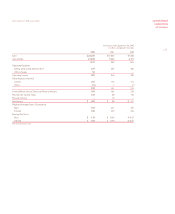
in millions
Sales by Segment 2002 2001 Change
Beef $10,488 $ 2,027 $ 8,461
Chicken 7,222 7,057 165
Pork 2,503 619 1,884
Prepared Foods 3,072 818 2,254
Other 82 42 40
Total $23,367 $10,563 $12,804
in millions
Operating Income (Loss) by Segment 2002 2001 Change
Beef $220 $ 32 $188
Chicken 428 250 178
Pork 25 27 (2)
Prepared Foods 158 15 143
Other 56 (8) 64
Total $887 $316 $571
Tyson Foods, Inc. 2002 annual report