Tyson Foods 2002 Annual Report Download - page 20
Download and view the complete annual report
Please find page 20 of the 2002 Tyson Foods annual report below. You can navigate through the pages in the report by either clicking on the pages listed below, or by using the keyword search tool below to find specific information within the annual report.-
 1
1 -
2
-
3
-
4
-
5
-
6
-
7
-
8
-
9
-
 10
10 -
 11
11 -
 12
12 -
 13
13 -
 14
14 -
 15
15 -
 16
16 -
 17
17 -
 18
18 -
 19
19 -
 20
20 -
 21
21 -
 22
22 -
 23
23 -
 24
24 -
 25
25 -
 26
26 -
 27
27 -
 28
28 -
 29
29 -
 30
30 -
31
-
32
-
33
-
34
-
35
-
36
-
37
-
38
-
39
-
40
-
41
-
42
-
43
-
44
-
45
-
46
-
47
-
48
-
49
-
50
-
51
-
52
-
53
-
54
-
55
-
56
-
57
-
58
-
59
-
60
-
61
-
62
-
63
 |
 |

management’s
discussion
and analysis
p 18
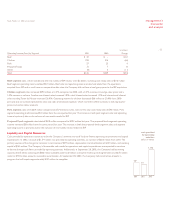
Results of Operations
Earnings for fiscal 2002 were $383 million or $1.08 per diluted share compared to $88 million or $0.40 per diluted share in fiscal 2001.
Fiscal 2002 earnings were positively affected by the addition of IBP, inc.’s (IBP) beef, pork and prepared foods operations, improved
performance of the chicken segment, a continued growth in value-added businesses and reduced operating costs. Additionally,
the Company recognized a gain from the sale of its Specialty Brands subsidiary and received a partial settlement related to ongoing
antitrust vitamin litigation. Earnings were adversely affected by charges related to the discontinuation of the Thomas E. Wilson brand,
from the restructuring of the Company’s live swine operation, an increase in interest expense and decreases in the international
markets which were influenced by import restrictions and political pressures.
On August 3, 2001, the Company acquired 50.1% ownership of IBP and acquired the remaining 49.9% on September 28, 2001.
Accordingly, fiscal 2002 earnings include 52 weeks of IBP’s results of operations, while fiscal 2001 fourth quarter and 12 months
results include 50.1% of IBP’s results for the nine weeks ended September 29, 2001. This information should be considered when
comparing to previous years’ results of operations.
The Company’s accounting cycle resulted in a 52-week year for fiscal years 2002, 2001 and 2000.
In accordance with the provisions issued in Financial Accounting Standards Board No. 142, “Goodwill and Other Intangible
Assets,” goodwill and indefinite lived assets are no longer amortized. The effect on current year results was an increase of
approximately $0.20 per diluted share.
In accordance with the guidance provided in Emerging Issues Task Force (EITF) Issue No. 00-14, “Accounting for Certain Sales
Incentives,” and EITF Issue No. 00-25, “Vendor Income Statement Characterization of Consideration Paid to a Reseller of the
Vendor’s Products,” beginning in the first quarter of fiscal 2002, the Company classifies the costs associated with sales incentives
provided to retailers and payments such as slotting fees and cooperative advertising to vendors as a reduction in sales. These costs
were previously included in selling, general and administrative expense. These reclassifications resulted in a reduction to sales and
selling, general and administrative expense of approximately $188 million and $142 million for fiscal years 2001 and 2000, respectively,
and had no impact on reported income before income taxes and minority interest, net income or earnings per share amounts.
2002 vs. 2001
Certain reclassifications have been made to prior periods to conform to current presentations.
Sales increased 121.2%, with a 98.9% increase in volume and an 11.2% increase in price. The increase in sales volume and price
is due primarily to the inclusion of IBP’s sales in fiscal 2002. Despite lower commodity prices, sales prices increased due to product
mix changes as the Company continues to grow its value-added businesses.
Cost of sales increased 123.1%, primarily due to the inclusion of IBP’s cost of sales in fiscal 2002. As a percent of sales, cost of sales
was 92.2% for 2002 compared to 91.5% for 2001.
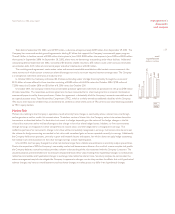
Operating expenses increased 58.4%, primarily due to the inclusion of IBP’s operations in fiscal 2002. Also included in operating
expenses are $53 million related to the discontinuation of the Thomas E. Wilson brand and the restructuring of the Company’s live
swine operation. As a percent of sales, operating expenses were 4.0% for 2002 compared to 5.6% in 2001. In its effort to integrate,
restructure and reorganize, the Company improved efficiencies and lowered plant operating costs. These costs were also reduced
through other cost-containment efforts and improved sales expense management.
Interest expense increased 111.8% compared to 2001. As a percent of sales, interest expense was 1.3% compared to 1.4% for
2001. The Company’s average indebtedness increased by 109.7% over the same period last year due to debt incurred to purchase
IBP. The Company’s short-term interest rates decreased to 3.3% in fiscal 2002 as compared to 5.1% in fiscal 2001. The net average
effective interest rate on total debt was 7.0% for 2002 compared to 6.9% for 2001.
Other income increased in the current year due to a gain of $22 million from the sale of the Specialty Brands, Inc. subsidiary.
Tyson Foods, Inc. 2002 annual report