Tyson Foods 2002 Annual Report Download - page 23
Download and view the complete annual report
Please find page 23 of the 2002 Tyson Foods annual report below. You can navigate through the pages in the report by either clicking on the pages listed below, or by using the keyword search tool below to find specific information within the annual report.-
 1
1 -
2
-
3
-
4
-
5
-
6
-
7
-
8
-
9
-
10
-
11
-
12
-
 13
13 -
 14
14 -
 15
15 -
 16
16 -
 17
17 -
 18
18 -
 19
19 -
 20
20 -
 21
21 -
 22
22 -
 23
23 -
 24
24 -
 25
25 -
 26
26 -
 27
27 -
 28
28 -
 29
29 -
 30
30 -
 31
31 -
 32
32 -
 33
33 -
34
-
35
-
36
-
37
-
38
-
39
-
40
-
41
-
42
-
43
-
44
-
45
-
46
-
47
-
48
-
49
-
50
-
51
-
52
-
53
-
54
-
55
-
56
-
57
-
58
-
59
-
60
-
61
-
62
-
63
 |
 |

management’s
discussion
and analysis
p 21
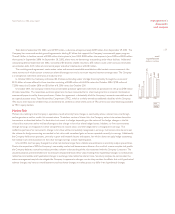
Disposition
In September 2002, the Company completed the sale of its Specialty Brands, Inc. subsidiary. The subsidiary had been acquired with
the IBP acquisition and its results of operations were included in the Company’s prepared foods segment. The Company received cash
proceeds of approximately $131 million which were used to reduce indebtedness and recognized a pretax gain of $22 million. Specialty
Brand, Inc.’s sales and operating income for the year ended September 28, 2002, were $244 million and $2 million respectively.
2001 vs. 2000
Certain reclassifications have been made to prior periods to conform to current presentations.
Sales increased 45.3%, with a 29.8% increase in volume and a 12.0% increase in price. The increase in sales is primarily due
to the inclusion of nine weeks of IBP’s sales in 2001. Comparable sales increased 3.4% on a volume increase of 1.1%. Breast meat
commodity market prices were pressured by an oversupply of chicken for much of the fiscal year causing an adverse effect on the
average sales prices and margins of many of the Company’s core value-added products. During the fourth quarter of 2001, the
Company experienced improved pricing of value-added products and seasonal price increases.
Cost of sales increased 49.7%, primarily due to the added cost of sales for nine weeks of IBP’s operations. As a percent of sales,
cost of sales was 91.5% for 2001 compared to 88.8% for 2000. Excluding IBP, comparable cost of sales as a percent of sales was
90.0%. The increase in comparable cost of sales, as a percent of sales, was primarily due to weather-related effects combined with
higher grain and energy costs, lower market prices and product mix changes.
Operating expenses increased 26.0%, primarily due to the inclusion of nine weeks of IBP’s operations in 2001. As a percent
of sales, operating expenses were 5.6% for 2001 compared to 6.4% in 2000. Excluding IBP, comparable operating expenses as a
percent of sales were 8.1% for 2001. The increase is primarily due to an increase in sales promotional expenses and litigation costs
related to the acquisition of IBP and ongoing employee practice matters. Included in the 2000 operating expenses was $24 million
in bad debt reserve resulting from the bankruptcy filing by AmeriServe Food Distribution, Inc. (AmeriServe).
Interest expense increased 24.1% compared to 2000. As a percent of sales, interest expense was 1.4% compared to 1.6% for 2000.
The Company’s average indebtedness increased by 24.3% over the 2000 amount as a result of the IBP acquisition. The Company’s
short-term interest rates were slightly lower than the same period last year, and the net average effective interest rate on total debt
was 6.9% for 2001 and 2000.
The effective tax rate was 35.4% in 2001 compared to 35.6% in 2000.
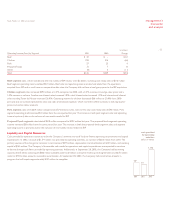
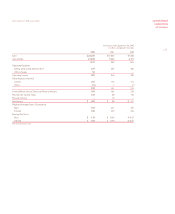
Segment Information
The following information includes nine weeks results for the period ending September 29, 2001, related to the IBP acquisition,
stated prior to adjustments for minority interest.
in millions
Sales by Segment 2001 2000 Change
Beef $ 2,027 $ – $2,027
Chicken 7,057 6,767 290
Pork 619 157 462
Prepared Foods 818 292 526
Other 42 52 (10)
Total $10,563 $7,268 $3,295
Tyson Foods, Inc. 2002 annual report