Toyota 2006 Annual Report Download - page 92
Download and view the complete annual report
Please find page 92 of the 2006 Toyota annual report below. You can navigate through the pages in the report by either clicking on the pages listed below, or by using the keyword search tool below to find specific information within the annual report.-
 1
1 -
2
-
3
-
4
-
5
-
6
-
7
-
8
-
9
-
10
-
11
-
12
-
13
-
14
-
15
-
16
-
17
-
18
-
19
-
20
-
21
-
22
-
23
-
24
-
25
-
26
-
27
-
28
-
29
-
30
-
31
-
32
-
33
-
34
-
35
-
36
-
37
-
38
-
39
-
40
-
41
-
42
-
43
-
44
-
45
-
46
-
47
-
48
-
49
-
50
-
51
-
52
-
53
-
54
-
55
-
56
-
57
-
58
-
59
-
60
-
61
-
62
-
63
-
64
-
65
-
66
-
67
-
68
-
69
-
70
-
71
-
72
-
73
-
74
-
75
-
76
-
77
-
78
-
79
-
80
-
81
-
 82
82 -
 83
83 -
 84
84 -
 85
85 -
 86
86 -
 87
87 -
 88
88 -
 89
89 -
 90
90 -
 91
91 -
 92
92 -
 93
93 -
 94
94 -
 95
95 -
 96
96 -
 97
97 -
 98
98 -
 99
99 -
 100
100 -
 101
101 -
 102
102 -
103
-
104
-
105
-
106
-
107
-
108
-
109
-
110
-
111
-
112
-
113
-
114
-
115
-
116
-
117
-
118
-
119
-
120
-
121
-
122
-
123
-
124
-
125
-
126
-
127
-
128
-
129
-
130
-
131
-
132
-
133
-
134
-
135
-
136
-
137
-
138
-
139
-
140
 |
 |

90
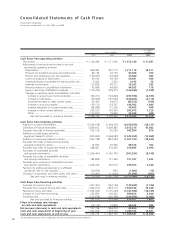
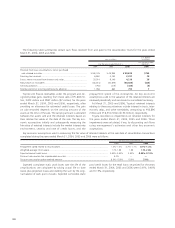
Consolidated Statements of Cash Flows
Toyota Motor Corporation
For the years ended March 31, 2004, 2005, and 2006
U.S. dollars
Yen in millions in millions
2004 2005 2006 2006
Cash flows from operating activities
Net income....................................................................... ¥ 1,162,098 ¥ 1,171,260 ¥ 1,372,180 $ 11,681
Adjustments to reconcile net income to net cash
provided by operating activities
Depreciation.................................................................. 969,904 997,713 1,211,178 10,311
Provision for doubtful accounts and credit losses ........... 83,138 63,154 62,646 533
Pension and severance costs, less payments ................... (159,267) (52,933) 23,860 203
Losses on disposal of fixed assets................................... 39,742 49,159 54,981 468
Unrealized losses on available-for-sale securities, net...... 3,063 2,324 4,163 36
Deferred income taxes................................................... 120,828 84,711 33,262 283
Minority interest in consolidated subsidiaries ................. 42,686 64,938 84,393 718
Equity in earnings of affiliated companies...................... (120,295) (139,471) (164,366) (1,399)
Changes in operating assets and liabilities, and other
Increase in accounts and notes receivable .................. (90,721) (178,363) (297,598) (2,533)
Increase in inventories................................................ (53,609) (191,545) (248,823) (2,118)
(Increase) decrease in other current assets.................. 43,445 34,674 (89,723) (764)
Increase in accounts payable...................................... 159,120 153,747 188,702 1,606
Increase (decrease) in accrued income taxes ............... (66,006) 41,228 54,052 460
Increase in other current liabilities .............................. 203,535 190,450 203,075 1,729
Other ........................................................................ (150,927) 79,894 23,498 200
Net cash provided by operating activities................ 2,186,734 2,370,940 2,515,480 21,414
Cash flows from investing activities
Additions to finance receivables ........................................ (5,234,578) (5,594,375) (6,476,979) (55,137)
Collection of finance receivables........................................ 3,839,812 4,609,383 5,615,276 47,802
Proceeds from sale of finance receivables .......................... 243,128 65,536 102,854 876
Additions to fixed assets excluding
equipment leased to others ............................................ (945,803) (1,068,287) (1,523,459) (12,969)
Additions to equipment leased to others........................... (542,738) (854,953) (1,247,781) (10,622)
Proceeds from sales of fixed assets excluding
equipment leased to others............................................. 73,925 69,396 89,578 762
Proceeds from sales of equipment leased to others............ 288,681 316,456 410,683 3,496
Purchases of marketable securities
and security investments ................................................. (1,336,467) (1,165,791) (957,296) (8,149)
Proceeds from sales of marketable securities
and security investments ................................................. 183,808 121,369 157,707 1,342
Proceeds upon maturity of marketable securities
and security investments ................................................. 1,252,334 452,574 533,325 4,540
Payment for additional investments in affiliated
companies, net of cash acquired ..................................... (20,656) (901) (1,802) (15)
Changes in investments and other assets, and other.......... (17,941) (11,603) (77,606) (661)
Net cash used in investing activities........................ (2,216,495) (3,061,196) (3,375,500) (28,735)
Cash flows from financing activities
Purchase of common stock ............................................... (357,457) (264,106) (129,629) (1,104)
Proceeds from issuance of long-term debt......................... 1,636,570 1,863,710 1,928,788 16,420
Payments of long-term debt.............................................. (1,253,045) (1,155,223) (1,187,506) (10,109)
Increase in short-term borrowings..................................... 353,833 140,302 509,826 4,340
Dividends paid .................................................................. (137,678) (165,299) (244,568) (2,082)
Net cash provided by financing activities ................ 242,223 419,384 876,911 7,465
Effect of exchange rate changes
on cash and cash equivalents........................................ (74,714) 24,849 68,743 585
Net increase (decrease) in cash and cash equivalents.... 137,748 (246,023) 85,634 729
Cash and cash equivalents at beginning of year........... 1,592,028 1,729,776 1,483,753 12,631
Cash and cash equivalents at end of year...................... ¥ 1,729,776 ¥ 1,483,753 ¥ 1,569,387 $ 13,360
The accompanying notes are an integral part of these consolidated financial statements.