Toyota 2006 Annual Report Download - page 73
Download and view the complete annual report
Please find page 73 of the 2006 Toyota annual report below. You can navigate through the pages in the report by either clicking on the pages listed below, or by using the keyword search tool below to find specific information within the annual report.-
 1
1 -
2
-
3
-
4
-
5
-
6
-
7
-
8
-
9
-
10
-
11
-
12
-
13
-
14
-
15
-
16
-
17
-
18
-
19
-
20
-
21
-
22
-
23
-
24
-
25
-
26
-
27
-
28
-
29
-
30
-
31
-
32
-
33
-
34
-
35
-
36
-
37
-
38
-
39
-
40
-
41
-
42
-
43
-
44
-
45
-
46
-
47
-
48
-
49
-
50
-
51
-
52
-
53
-
54
-
55
-
56
-
57
-
58
-
59
-
60
-
61
-
62
-
 63
63 -
 64
64 -
 65
65 -
 66
66 -
 67
67 -
 68
68 -
 69
69 -
 70
70 -
 71
71 -
 72
72 -
 73
73 -
 74
74 -
 75
75 -
 76
76 -
 77
77 -
 78
78 -
 79
79 -
 80
80 -
 81
81 -
 82
82 -
 83
83 -
84
-
85
-
86
-
87
-
88
-
89
-
90
-
91
-
92
-
93
-
94
-
95
-
96
-
97
-
98
-
99
-
100
-
101
-
102
-
103
-
104
-
105
-
106
-
107
-
108
-
109
-
110
-
111
-
112
-
113
-
114
-
115
-
116
-
117
-
118
-
119
-
120
-
121
-
122
-
123
-
124
-
125
-
126
-
127
-
128
-
129
-
130
-
131
-
132
-
133
-
134
-
135
-
136
-
137
-
138
-
139
-
140
 |
 |
71
which was partially offset by changes in sales mix compared to
fiscal 2004. Net revenues in North America were favorably
impacted by vehicle unit sales growth, but were partially offset
by the impact of fluctuations in foreign currency translation
rates during fiscal 2005. Net revenues in Europe were favorably
impacted primarily by vehicle unit sales growth and fluctuations
in foreign currency translation rates during fiscal 2005. Net rev-
enues in Asia were favorably impacted, primarily attributed to
vehicle unit sales growth that includes sales both to Asia and
outside of Asia due to the IMV series, which was launched in
fiscal 2004. Net revenues in Other were favorably impacted pri-
marily by vehicle unit sales growth due to the IMV series.
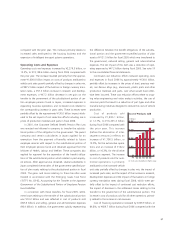
Financial Services Operations Segment
Net revenues in fiscal 2005 for Toyota’s financial services opera-
tions increased by ¥44.3 billion or 6.0% compared to the prior
year to ¥781.2 billion. This increase resulted primarily from the
impact of a higher volume of financings and the impact of
adjustments made by a sales financing subsidiary in the United
States for the correction of errors relating to prior periods (see
note 24 to the consolidated financial statements), but was par-
tially offset by the unfavorable impact of fluctuations in foreign
currency translation rates during fiscal 2005. Eliminating the dif-
ference in the yen value used for translation purposes, financial
services operations net revenues would have been approximate-
ly ¥803.7 billion during fiscal 2005, a 9.1% increase compared
with the prior year.
All Other Operations Segment
Net revenues for Toyota’s other businesses increased by ¥134.1
billion, or 15.0%, to ¥1,030.3 billion during fiscal 2005 com-
pared with the prior year. This increase primarily relates to
increased sales attributed to the housing business.
Operating Costs and Expenses
Operating costs and expenses increased by ¥1,251.5 billion, or
8.0%, to ¥16,879.3 billion during fiscal 2005 compared with
the prior year. The increase resulted primarily from the approxi-
mate ¥1,100.0 billion impact on costs of products attributed to
vehicle unit sales growth partially offset by changes in sales mix,
a ¥72.9 billion increase in research and development expenses,
a ¥59.8 billion decrease in net gains relating to the transfer to
the government of the substitutional portion of certain employee
pension funds in Japan, increased expenses in expanding busi-
ness operations and increased costs related to the correspon-
ding increase in parts and service sales. These increases were
partially offset by approximately ¥160.0 billion of cost reduction
efforts in fiscal 2005.
In 2001, the Corporate Defined Benefit Pension Plan Law
was enacted and the parent company and certain subsidiaries in
Japan completed the transfers of the government-specified por-
tion of plan assets relating to the substitutional portion in fiscal
2004. Several additional subsidiaries in Japan also completed
the transfers of the government-specified portion of plan assets
in fiscal 2005.
In connection with these transfers, for fiscal 2004 and
2005, settlement losses relating to the transfer of the substitu-
tional portion was ¥213.9 billion and ¥74.3 billion, respectively
and is reflected in cost of products sold (¥190.1 billion and
¥65.9 billion, respectively) and selling, general and administra-
tive expenses (¥23.8 billion and ¥8.4 billion, respectively). In
addition, the government subsidy representing the difference
between the benefit obligations of the substitutional portion
and the government-specified portion of plan assets of ¥320.9
billion for fiscal 2004 and ¥121.5 billion for fiscal 2005, respec-
tively, which were both transferred to the government, reduced
selling, general and administrative expenses. The net impact of
these items was a reduction of operating expenses by ¥47.2 bil-
lion during fiscal 2005, which increased by ¥59.8 billion com-
pared to a reduction of operating expenses by ¥107.0 billion
during fiscal 2004. See note 19 to the consolidated financial
statements.
Continued cost reduction efforts reduced operating costs
and expenses in fiscal 2005 by approximately ¥160.0 billion
over what would have otherwise been incurred. These cost
reduction efforts relate to ongoing value engineering and value
analysis activities, the use of common parts that result in a
reduction of part types and other manufacturing initiatives
designed to reduce the costs of vehicle production.
Cost of products sold increased by ¥993.9 billion, or 7.4%,
to ¥14,500.2 billion during fiscal 2005 compared with the prior
year. This increase (before the elimination of intersegment
amounts) reflects an increase of ¥881.6 billion, or 6.8%, for the
automotive operations and an increase of ¥112.5 billion, or
14.8%, for the all other operations segment. The increase in
cost of products sold for the automotive operations is primarily