Toyota 2006 Annual Report Download - page 68
Download and view the complete annual report
Please find page 68 of the 2006 Toyota annual report below. You can navigate through the pages in the report by either clicking on the pages listed below, or by using the keyword search tool below to find specific information within the annual report.-
 1
1 -
2
-
3
-
4
-
5
-
6
-
7
-
8
-
9
-
10
-
11
-
12
-
13
-
14
-
15
-
16
-
17
-
18
-
19
-
20
-
21
-
22
-
23
-
24
-
25
-
26
-
27
-
28
-
29
-
30
-
31
-
32
-
33
-
34
-
35
-
36
-
37
-
38
-
39
-
40
-
41
-
42
-
43
-
44
-
45
-
46
-
47
-
48
-
49
-
50
-
51
-
52
-
53
-
54
-
55
-
56
-
57
-
 58
58 -
 59
59 -
 60
60 -
 61
61 -
 62
62 -
 63
63 -
 64
64 -
 65
65 -
 66
66 -
 67
67 -
 68
68 -
 69
69 -
 70
70 -
 71
71 -
 72
72 -
 73
73 -
 74
74 -
 75
75 -
 76
76 -
 77
77 -
 78
78 -
79
-
80
-
81
-
82
-
83
-
84
-
85
-
86
-
87
-
88
-
89
-
90
-
91
-
92
-
93
-
94
-
95
-
96
-
97
-
98
-
99
-
100
-
101
-
102
-
103
-
104
-
105
-
106
-
107
-
108
-
109
-
110
-
111
-
112
-
113
-
114
-
115
-
116
-
117
-
118
-
119
-
120
-
121
-
122
-
123
-
124
-
125
-
126
-
127
-
128
-
129
-
130
-
131
-
132
-
133
-
134
-
135
-
136
-
137
-
138
-
139
-
140
 |
 |
66
Results of Operations—Fiscal 2006 Compared
with Fiscal 2005
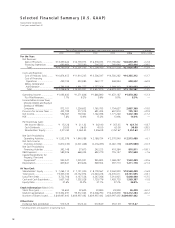
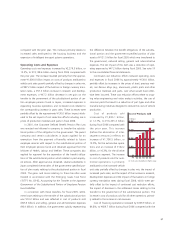
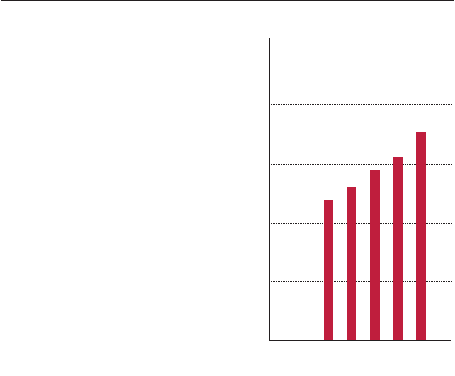
Net Revenues
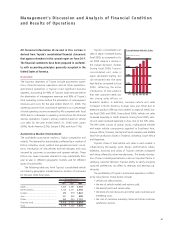
Toyota had net revenues for fiscal
2006 of ¥21,036.9 billion, an
increase of ¥2,485.4 billion, or
13.4%, compared with the prior
year. This increase principally
reflects the impact of increased
vehicle unit sales, increased parts
sales, increased financings and the
favorable impact of fluctuations in
foreign currency translation rates
during fiscal 2006. Eliminating the
difference in the yen value used
for translation purposes, net rev-
enues would have been approxi-
mately ¥20,405.1 billion during fiscal 2006, a 10.0% increase
compared with the prior year. Toyota’s net revenues include net
revenues from sales of products that increased during fiscal
2006 by 12.8% from the prior year to ¥20,059.5 billion and net
revenues from financing operations that increased 28.5% in fis-
cal 2006 compared with the prior year to ¥977.4 billion.
Eliminating the difference in the yen value used for translation
purposes, net revenues from sales of products would have been
approximately ¥19,472.4 billion, a 9.5% increase, while net rev-
enues from financing operations would have increased approxi-
mately 22.6% during fiscal 2006 compared to the prior year to
¥932.7 billion. Geographically, net revenues for fiscal 2006
increased by 4.4% in Japan, 20.5% in North America, 11.6% in
Europe, 16.8% in Asia and 33.1% in Other compared with the
prior year. Eliminating the difference in the yen value used for
translation purposes, net revenues in fiscal 2006 would have
increased by 4.4% in Japan, 14.2% in North America, 9.2% in
Europe, 11.1% in Asia and 24.4% in Other compared with the
prior year.
The following is a discussion of net revenues for each
of Toyota’s business segments. The net revenue amounts
discussed are amounts before the elimination of intersegment
revenues.
Automotive Operations Segment
Net revenues from Toyota’s automotive operations segment,
which constitute the largest percentage of Toyota’s net rev-
enues, increased in fiscal 2006 by ¥2,224.6 billion, or 13.0%
compared with the prior year to ¥19,338.1 billion. The increase
resulted primarily from the approximate ¥1,200.0 billion impact
attributed to the vehicle unit sales growth partially offset by
changes in sales mix and the approximate ¥585.9 billion impact
of fluctuations in foreign currency translation rates during fiscal
2006 and the impact of increased parts sales. Eliminating the
difference in the yen value used for translation purposes, auto-
motive operations segment net revenues would have been
approximately ¥18,752.2 billion in fiscal 2006, a 9.6% increase
compared to the prior year. In fiscal 2006, net revenues in
Japan were favorably impacted primarily by vehicle unit sales
growth in the export markets, which was partially offset by
changes in sales mix compared to fiscal 2005. Net revenues in
North America were favorably impacted by vehicle unit sales
growth and fluctuations in foreign currency translation rates
during fiscal 2006. Net revenues in Europe were favorably
impacted primarily by vehicle unit sales growth and fluctuations
in foreign currency translation rates during fiscal 2006. Net
revenues in Asia were favorably impacted primarily by vehicle
unit sales growth that includes sales both to Asia and outside of
Asia due to the IMV series and the favorable impact of fluctua-
tions in foreign currency translation rates during fiscal 2006.
Net revenues in Other were favorably impacted primarily by
vehicle unit sales growth due to the IMV series.
Financial Services Operations Segment
Net revenues in fiscal 2006 for Toyota’s financial services opera-
tions increased by ¥215.7 billion or 27.6% compared to the
prior year to ¥996.9 billion. This increase resulted primarily from
the impact of a higher volume of financings mainly in North
America and the favorable impact of fluctuations in foreign cur-
rency translation rates during fiscal 2006. Eliminating the differ-
ence in the yen value used for translation purposes, financial
services operations net revenues would have been approximate-
ly ¥952.0 billion during fiscal 2006, a 21.9% increase compared
with the prior year.
All Other Operations Segment
Net revenues for Toyota’s other businesses increased by ¥160.0
billion, or 15.5%, to ¥1,190.3 billion during fiscal 2006
12,000
6,000
18,000
24,000
’02 ’03 ’04 ’05 ’06
0
Net Revenues
(¥ Billion)
FY