Toyota 2006 Annual Report Download - page 88
Download and view the complete annual report
Please find page 88 of the 2006 Toyota annual report below. You can navigate through the pages in the report by either clicking on the pages listed below, or by using the keyword search tool below to find specific information within the annual report.-
 1
1 -
2
-
3
-
4
-
5
-
6
-
7
-
8
-
9
-
10
-
11
-
12
-
13
-
14
-
15
-
16
-
17
-
18
-
19
-
20
-
21
-
22
-
23
-
24
-
25
-
26
-
27
-
28
-
29
-
30
-
31
-
32
-
33
-
34
-
35
-
36
-
37
-
38
-
39
-
40
-
41
-
42
-
43
-
44
-
45
-
46
-
47
-
48
-
49
-
50
-
51
-
52
-
53
-
54
-
55
-
56
-
57
-
58
-
59
-
60
-
61
-
62
-
63
-
64
-
65
-
66
-
67
-
68
-
69
-
70
-
71
-
72
-
73
-
74
-
75
-
76
-
77
-
 78
78 -
 79
79 -
 80
80 -
 81
81 -
 82
82 -
 83
83 -
 84
84 -
 85
85 -
 86
86 -
 87
87 -
 88
88 -
 89
89 -
 90
90 -
 91
91 -
 92
92 -
 93
93 -
 94
94 -
 95
95 -
 96
96 -
 97
97 -
 98
98 -
99
-
100
-
101
-
102
-
103
-
104
-
105
-
106
-
107
-
108
-
109
-
110
-
111
-
112
-
113
-
114
-
115
-
116
-
117
-
118
-
119
-
120
-
121
-
122
-
123
-
124
-
125
-
126
-
127
-
128
-
129
-
130
-
131
-
132
-
133
-
134
-
135
-
136
-
137
-
138
-
139
-
140
 |
 |

86
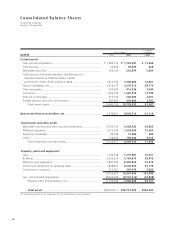
Consolidated Balance Sheets
Toyota Motor Corporation
March 31, 2005 and 2006
U.S. dollars
Yen in millions in millions
ASSETS 2005 2006 2006
Current assets
Cash and cash equivalents..................................................................... ¥ 1,483,753 ¥1,569,387 $ 13,360
Time deposits ....................................................................................... 63,609 50,349 428
Marketable securities ............................................................................ 543,124 634,879 5,405
Trade accounts and notes receivable, less allowance for
doubtful accounts of ¥18,656 million in 2005
and ¥19,491 million ($166 million) in 2006 ........................................ 1,813,725 1,980,680 16,861
Finance receivables, net......................................................................... 3,010,135 3,497,319 29,772
Other receivables .................................................................................. 355,381 416,336 3,544
Inventories............................................................................................ 1,306,709 1,620,975 13,799
Deferred income taxes........................................................................... 475,764 520,494 4,431
Prepaid expenses and other current assets............................................. 387,905 444,803 3,787
Total current assets ........................................................................ 9,440,105 10,735,222 91,387
Noncurrent finance receivables, net ................................................... 3,976,941 4,830,216 41,119
Investments and other assets
Marketable securities and other securities investments........................... 2,704,142 3,402,523 28,965
Affiliated companies ............................................................................. 1,570,185 1,828,369 15,565
Employees receivables ........................................................................... 49,538 75,094 639
Other.................................................................................................... 798,506 793,543 6,755
Total investments and other assets ................................................. 5,122,371 6,099,529 51,924
Property, plant and equipment
Land ..................................................................................................... 1,182,768 1,215,897 10,351
Buildings............................................................................................... 2,935,274 3,156,613 26,872
Machinery and equipment .................................................................... 7,897,509 8,482,832 72,213
Vehicles and equipment on operating leases ......................................... 1,828,697 2,605,426 22,179
Construction in progress ....................................................................... 214,781 397,076 3,380
14,059,029 15,857,844 134,995
Less—Accumulated depreciation........................................................... (8,263,435) (8,791,216) (74,838)
Property, plant and equipment, net ................................................ 5,795,594 7,066,628 60,157
Total assets.................................................................................. ¥24,335,011 ¥28,731,595 $244,587
The accompanying notes are an integral part of these consolidated financial statements.