Toyota 2006 Annual Report Download - page 130
Download and view the complete annual report
Please find page 130 of the 2006 Toyota annual report below. You can navigate through the pages in the report by either clicking on the pages listed below, or by using the keyword search tool below to find specific information within the annual report.-
 1
1 -
2
-
3
-
4
-
5
-
6
-
7
-
8
-
9
-
10
-
11
-
12
-
13
-
14
-
15
-
16
-
17
-
18
-
19
-
20
-
21
-
22
-
23
-
24
-
25
-
26
-
27
-
28
-
29
-
30
-
31
-
32
-
33
-
34
-
35
-
36
-
37
-
38
-
39
-
40
-
41
-
42
-
43
-
44
-
45
-
46
-
47
-
48
-
49
-
50
-
51
-
52
-
53
-
54
-
55
-
56
-
57
-
58
-
59
-
60
-
61
-
62
-
63
-
64
-
65
-
66
-
67
-
68
-
69
-
70
-
71
-
72
-
73
-
74
-
75
-
76
-
77
-
78
-
79
-
80
-
81
-
82
-
83
-
84
-
85
-
86
-
87
-
88
-
89
-
90
-
91
-
92
-
93
-
94
-
95
-
96
-
97
-
98
-
99
-
100
-
101
-
102
-
103
-
104
-
105
-
106
-
107
-
108
-
109
-
110
-
111
-
112
-
113
-
114
-
115
-
116
-
117
-
118
-
119
-
 120
120 -
 121
121 -
 122
122 -
 123
123 -
 124
124 -
 125
125 -
 126
126 -
 127
127 -
 128
128 -
 129
129 -
 130
130 -
 131
131 -
 132
132 -
 133
133 -
 134
134 -
 135
135 -
 136
136 -
 137
137 -
 138
138 -
 139
139 -
 140
140
 |
 |

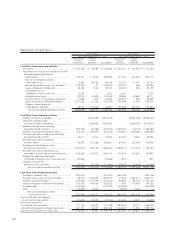
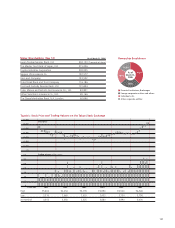
128
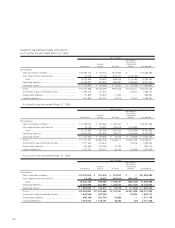
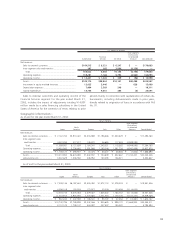
Statements of cash flows—
Yen in millions Yen in millions
For the year ended March 31, 2004 For the year ended March 31, 2005
Non-Financial Financial Non-Financial Financial
Services Services Services Services
Businesses Businesses Consolidated Businesses Businesses Consolidated
Cash flows from operating activities
Net income ............................................................ ¥ 1,074,758 ¥ 87,539 ¥ 1,162,098 ¥ 1,047,741 ¥ 123,975 ¥ 1,171,260
Adjustments to reconcile net income to net cash
provided by operating activities
Depreciation....................................................... 794,371 175,533 969,904 777,129 220,584 997,713
Provision for doubtful accounts
and credit losses............................................... 13,356 69,782 83,138 15,752 47,402 63,154
Pension and severance costs, less payments ........ (159,291) 24 (159,267) (53,401) 468 (52,933)
Losses on disposal of fixed assets........................ 38,708 1,034 39,742 48,334 825 49,159
Unrealized losses on
available-for-sale securities, net ........................ 3,063 — 3,063 2,324 — 2,324
Deferred income taxes........................................ 82,918 37,603 120,828 29,398 54,860 84,711
Minority interest in consolidated subsidiaries ...... 41,886 815 42,686 63,952 988 64,938
Equity in earnings of affiliated companies ........... (107,542) (12,753) (120,295) (131,849) (7,622) (139,471)
Changes in operating assets
and liabilities, and other ................................... 88,212 (13,546) 44,837 (97,535) 203,762 130,085
Net cash provided by operating activities ........ 1,870,439 346,031 2,186,734 1,701,845 645,242 2,370,940
Cash flows from investing activities
Additions to finance receivables.............................. — (8,814,390) (5,234,578) — (9,562,203) (5,594,375)
Collection of and proceeds
from sale of finance receivables ............................ — 7,566,463 4,082,940 — 8,586,796 4,674,919
Additions to fixed assets excluding
equipment leased to others .................................. (923,105) (22,698) (945,803) (1,049,572) (18,715) (1,068,287)
Additions to equipment leased to others ................ (133,214) (409,524) (542,738) (146,891) (708,062) (854,953)
Proceeds from sales of fixed assets excluding
equipment leased to others .................................. 63,211 10,714 73,925 60,034 9,362 69,396
Proceeds from sales of equipment
leased to others.................................................... 78,393 210,288 288,681 84,450 232,006 316,456
Purchases of marketable securities
and security investments....................................... (1,077,317) (259,150) (1,336,467) (1,053,417) (112,374) (1,165,791)
Proceeds from sales of and maturity of
marketable securities and security investments...... 1,108,265 327,877 1,436,142 471,614 102,329 573,943
Payment for additional investments
in affiliated companies, net of cash acquired......... (20,656) — (20,656) (901) — (901)
Changes in investments
and other assets, and other .................................. (16,051) (41,054) (17,941) 84,979 (16,485) (11,603)
Net cash used in investing activities ................ (920,474) (1,431,474) (2,216,495) (1,549,704) (1,487,346) (3,061,196)
Cash flows from financing activities
Purchase of common stock..................................... (357,457) — (357,457) (264,106) — (264,106)
Proceeds from issuance of long-term debt .............. 48,373 1,682,550 1,636,570 27,363 1,862,012 1,863,710
Payments of long-term debt ................................... (140,384) (1,187,219) (1,253,045) (59,689) (1,160,710) (1,155,223)
Increase (decrease) in short-term borrowings .......... (105,051) 544,806 353,833 564 178,956 140,302
Dividends paid........................................................ (137,678) — (137,678) (165,299) — (165,299)
Other ..................................................................... (15,000) 15,000 — (7,000) 7,000 —
Net cash provided by (used in)
financing activities........................................ (707,197) 1,055,137 242,223 (468,167) 887,258 419,384
Effect of exchange rate changes
on cash and cash equivalents.................................... (61,623) (13,091) (74,714) 21,276 3,573 24,849
Net increase (decrease)
in cash and cash equivalents..................................... 181,145 (43,397) 137,748 (294,750) 48,727 (246,023)
Cash and cash equivalents at beginning of year .......... 1,437,731 154,297 1,592,028 1,618,876 110,900 1,729,776
Cash and cash equivalents at end of year .................... ¥ 1,618,876 ¥ 110,900 ¥ 1,729,776 ¥ 1,324,126 ¥ 159,627 ¥ 1,483,753