Toyota 2006 Annual Report Download - page 75
Download and view the complete annual report
Please find page 75 of the 2006 Toyota annual report below. You can navigate through the pages in the report by either clicking on the pages listed below, or by using the keyword search tool below to find specific information within the annual report.-
 1
1 -
2
-
3
-
4
-
5
-
6
-
7
-
8
-
9
-
10
-
11
-
12
-
13
-
14
-
15
-
16
-
17
-
18
-
19
-
20
-
21
-
22
-
23
-
24
-
25
-
26
-
27
-
28
-
29
-
30
-
31
-
32
-
33
-
34
-
35
-
36
-
37
-
38
-
39
-
40
-
41
-
42
-
43
-
44
-
45
-
46
-
47
-
48
-
49
-
50
-
51
-
52
-
53
-
54
-
55
-
56
-
57
-
58
-
59
-
60
-
61
-
62
-
63
-
64
-
 65
65 -
 66
66 -
 67
67 -
 68
68 -
 69
69 -
 70
70 -
 71
71 -
 72
72 -
 73
73 -
 74
74 -
 75
75 -
 76
76 -
 77
77 -
 78
78 -
 79
79 -
 80
80 -
 81
81 -
 82
82 -
 83
83 -
 84
84 -
 85
85 -
86
-
87
-
88
-
89
-
90
-
91
-
92
-
93
-
94
-
95
-
96
-
97
-
98
-
99
-
100
-
101
-
102
-
103
-
104
-
105
-
106
-
107
-
108
-
109
-
110
-
111
-
112
-
113
-
114
-
115
-
116
-
117
-
118
-
119
-
120
-
121
-
122
-
123
-
124
-
125
-
126
-
127
-
128
-
129
-
130
-
131
-
132
-
133
-
134
-
135
-
136
-
137
-
138
-
139
-
140
 |
 |
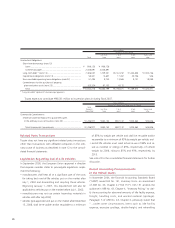
73
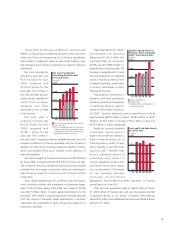
attributed to business expansion in North America and the
impact of fluctuations in foreign currency translation rates. The
increase in the European market operating income relates main-
ly to the impact of cost reduction efforts in the manufacturing
operations, an increase in production volume and vehicle unit
sales and the favorable impact of fluctuations in foreign curren-
cy translation rates, which were partially offset by increases in
expenses attributed to expansion of operations. The increase in
Asia relates primarily to the impact of the increase in production
volume and vehicle unit sales mainly attributed to the IMV
series. The increase in Other relates primarily to the impact of
the increase in production volume and vehicle unit sales mainly
attributed to the IMV series.
The following is a discussion of operating income for each
of Toyota’s business segments. The operating income amounts
discussed are before the elimination of intersegment profits.
Automotive Operations Segment
Operating income from Toyota’s automotive operations
decreased by ¥66.5 billion, or 4.4%, to ¥1,452.5 billion during
fiscal 2005 compared with the prior year. Operating income
was unfavorably affected by the impact of the reduction in net
gains attributed to the transfer to the government of the substi-
tutional portion of certain employee pension funds, the increase
in research and development expenses, the increase in expenses
corresponding to business expansion and the impact of fluctua-
tions in foreign currency translation rates. These decreases were
partially offset by the increase in vehicle unit sales, the increase
in parts and service sales, and the impact of continued cost
reduction efforts.
Financial Services Operations Segment
Operating income from Toyota’s financial services operations
increased by ¥54.8 billion, or 37.6%, to ¥200.8 billion during
fiscal 2005 compared with the prior year. This increase was pri-
marily due to an increase in the finance receivables asset base,
the impact of adjustments made by a sales financing subsidiary
for the correction of errors relating to prior periods (see note 24
to the consolidated financial statements), the impact of lower
provisions for credit losses and the allowance for residual value
losses in the United States. These increases were partially offset
by the impact of fluctuations in foreign currency translation
rates.
All Other Operations Segment
Operating income from Toyota’s other businesses increased by
¥18.5 billion, or 2.2 times, to ¥33.7 billion during fiscal 2005.
This increase primarily relates to increased production volume
and sales attributed to the housing business.
Other Income and Expenses
Interest and dividend income increased by ¥11.9 billion, or
21.4%, to ¥67.5 billion during fiscal 2005 compared with the
prior year due to an increase in investment securities held by the
United States subsidiaries.
Interest expense decreased by ¥1.8 billion, or 8.5%, to
¥18.9 billion during fiscal 2005 compared with the prior year
due to a decrease in borrowings in the automotive operations
segment.
Foreign exchange gains, net decreased by ¥16.7 billion, or
43.9%, to ¥21.4 billion during fiscal 2005 compared with the
prior year. Foreign exchange gains and losses include the differ-
ences between the value of foreign currency denominated sales
translated at prevailing exchange rates and the value of the
sales amounts settled during the year, including those settled
using forward foreign currency exchange contracts.
Other income, net decreased by ¥13.3 billion, or 51.7%, to
¥12.4 billion during fiscal 2005 due to an increase in donations
paid to educational institutions.
Income Taxes
The provision for income taxes decreased ¥23.4 billion in fiscal
2005 compared with the prior year primarily due to the
decrease in income before income taxes. In addition, the provi-
sion decreased as a result of the reduction in the effective tax
rate for fiscal 2005, which decreased to 37.5% from 38.6% for
the prior year mainly attributed to the reduction in the statutory
tax rate in Japan.
Minority Interest in Consolidated Subsidiaries and
Equity in Earnings of Affiliated Companies
Minority interest in consolidated subsidiaries increased by ¥22.3
billion to ¥64.9 billion during fiscal 2005 compared with the
prior year. This increase was mainly due to favorable operating
results at consolidated subsidiaries.
Equity in earnings of affiliated companies during fiscal 2005
increased by ¥19.2 billion to ¥139.4 billion compared with the
prior year due to an increase in net income attributable to