Toyota 2006 Annual Report Download - page 120
Download and view the complete annual report
Please find page 120 of the 2006 Toyota annual report below. You can navigate through the pages in the report by either clicking on the pages listed below, or by using the keyword search tool below to find specific information within the annual report.-
 1
1 -
2
-
3
-
4
-
5
-
6
-
7
-
8
-
9
-
10
-
11
-
12
-
13
-
14
-
15
-
16
-
17
-
18
-
19
-
20
-
21
-
22
-
23
-
24
-
25
-
26
-
27
-
28
-
29
-
30
-
31
-
32
-
33
-
34
-
35
-
36
-
37
-
38
-
39
-
40
-
41
-
42
-
43
-
44
-
45
-
46
-
47
-
48
-
49
-
50
-
51
-
52
-
53
-
54
-
55
-
56
-
57
-
58
-
59
-
60
-
61
-
62
-
63
-
64
-
65
-
66
-
67
-
68
-
69
-
70
-
71
-
72
-
73
-
74
-
75
-
76
-
77
-
78
-
79
-
80
-
81
-
82
-
83
-
84
-
85
-
86
-
87
-
88
-
89
-
90
-
91
-
92
-
93
-
94
-
95
-
96
-
97
-
98
-
99
-
100
-
101
-
102
-
103
-
104
-
105
-
106
-
107
-
108
-
109
-
 110
110 -
 111
111 -
 112
112 -
 113
113 -
 114
114 -
 115
115 -
 116
116 -
 117
117 -
 118
118 -
 119
119 -
 120
120 -
 121
121 -
 122
122 -
 123
123 -
 124
124 -
 125
125 -
 126
126 -
 127
127 -
 128
128 -
 129
129 -
 130
130 -
131
-
132
-
133
-
134
-
135
-
136
-
137
-
138
-
139
-
140
 |
 |
118
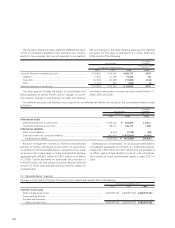
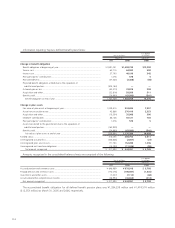
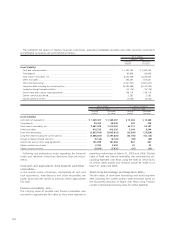
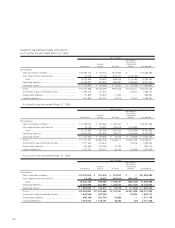
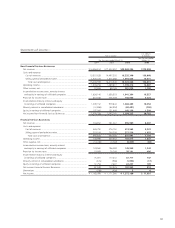
The estimated fair values of Toyota’s financial instruments, excluding marketable securities and other securities investments
and affiliated companies, are summarized as follows:
Yen in millions
March 31, 2005
Carrying Estimated
amount fair value
Asset (Liability)
Cash and cash equivalents ............................................................................................................ ¥ 1,483,753 ¥ 1,483,753
Time deposits ............................................................................................................................... 63,609 63,609
Total finance receivables, net ........................................................................................................ 6,243,359 6,234,855
Other receivables .......................................................................................................................... 355,381 355,381
Short-term borrowings ................................................................................................................. (2,381,827) (2,381,827)
Long-term debt including the current portion ............................................................................... (6,094,565) (6,140,043)
Foreign exchange forward contracts ............................................................................................. (10,176) (10,176)
Interest rate and currency swap agreements ................................................................................. 148,119 148,119
Option contracts purchased.......................................................................................................... 2,282 2,282
Option contracts written............................................................................................................... (4,042) (4,042)
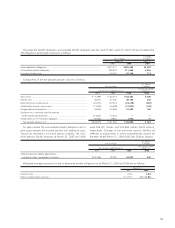
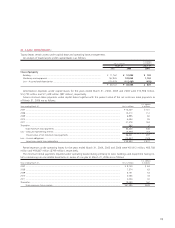
Yen in millions U.S. dollars in millions
March 31, 2006 March 31, 2006
Carrying Estimated Carrying Estimated
amount fair value amount fair value
Asset (Liability)
Cash and cash equivalents ..................................................................... ¥ 1,569,387 ¥ 1,569,387 $ 13,360 $ 13,360
Time deposits ........................................................................................ 50,349 50,349 428 428
Total finance receivables, net ................................................................. 7,601,838 7,413,229 64,713 63,107
Other receivables ................................................................................... 416,336 416,336 3,544 3,544
Short-term borrowings .......................................................................... (3,033,019) (3,033,019) (25,820) (25,820)
Long-term debt including the current portion ........................................ (7,306,037) (7,297,826) (62,195) (62,125)
Foreign exchange forward contracts....................................................... (8,136) (8,136) (69) (69)
Interest rate and currency swap agreements........................................... 101,890 101,890 867 867
Option contracts purchased ................................................................... 2,994 2,994 25 25
Option contracts written........................................................................ (3,035) (3,035) (26) (26)
Following are explanatory notes regarding the financial
assets and liabilities other than derivative financial instru-
ments.
Cash and cash equivalents, time deposits and other
receivables—
In the normal course of business, substantially all cash and
cash equivalents, time deposits and other receivables are
highly liquid and are carried at amounts which approximate
fair value.
Finance receivables, net—
The carrying value of variable rate finance receivables was
assumed to approximate fair value as they were repriced at
prevailing market rates at March 31, 2005 and 2006. The fair
value of fixed rate finance receivables was estimated by dis-
counting expected cash flows using the rates at which loans
of similar credit quality and maturity would be made as of
March 31, 2005 and 2006.
Short-term borrowings and long-term debt—
The fair values of short-term borrowings and total long-term
debt including the current portion were estimated based on
the discounted amounts of future cash flows using Toyota’s
current incremental borrowing rates for similar liabilities.