Toyota 2006 Annual Report Download - page 118
Download and view the complete annual report
Please find page 118 of the 2006 Toyota annual report below. You can navigate through the pages in the report by either clicking on the pages listed below, or by using the keyword search tool below to find specific information within the annual report.-
 1
1 -
2
-
3
-
4
-
5
-
6
-
7
-
8
-
9
-
10
-
11
-
12
-
13
-
14
-
15
-
16
-
17
-
18
-
19
-
20
-
21
-
22
-
23
-
24
-
25
-
26
-
27
-
28
-
29
-
30
-
31
-
32
-
33
-
34
-
35
-
36
-
37
-
38
-
39
-
40
-
41
-
42
-
43
-
44
-
45
-
46
-
47
-
48
-
49
-
50
-
51
-
52
-
53
-
54
-
55
-
56
-
57
-
58
-
59
-
60
-
61
-
62
-
63
-
64
-
65
-
66
-
67
-
68
-
69
-
70
-
71
-
72
-
73
-
74
-
75
-
76
-
77
-
78
-
79
-
80
-
81
-
82
-
83
-
84
-
85
-
86
-
87
-
88
-
89
-
90
-
91
-
92
-
93
-
94
-
95
-
96
-
97
-
98
-
99
-
100
-
101
-
102
-
103
-
104
-
105
-
106
-
107
-
 108
108 -
 109
109 -
 110
110 -
 111
111 -
 112
112 -
 113
113 -
 114
114 -
 115
115 -
 116
116 -
 117
117 -
 118
118 -
 119
119 -
 120
120 -
 121
121 -
 122
122 -
 123
123 -
 124
124 -
 125
125 -
 126
126 -
 127
127 -
 128
128 -
129
-
130
-
131
-
132
-
133
-
134
-
135
-
136
-
137
-
138
-
139
-
140
 |
 |

116
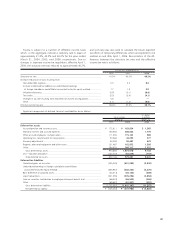
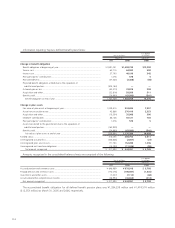
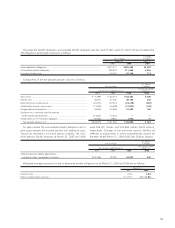
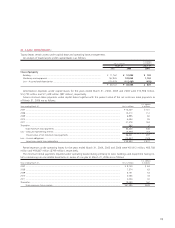
The following pension benefit payments, which reflect expected future service, as appropriate, are expected to be paid:
U.S. dollars
Years ending March 31, Yen in millions in millions
2007 ............................................................................................................................................................ ¥ 65,989 $ 562
2008 ............................................................................................................................................................ 65,677 559
2009 ............................................................................................................................................................ 73,050 622
2010 ............................................................................................................................................................ 69,887 595
2011 ............................................................................................................................................................ 68,986 587
from 2012 to 2016....................................................................................................................................... 343,657 2,925
Total..................................................................................................................................................... ¥687,246 $5,850
The expected rate of return on plan assets is determined
after considering several applicable factors including, the
composition of plan assets held, assumed risks of asset man-
agement, historical results of the returns on plan assets,
Toyota’s principal policy for plan asset management, and
forecasted market conditions.
Toyota’s policy and objective for plan asset management is
to maximize returns on plan assets to meet future benefit pay-
ment requirements under risks which Toyota considers permis-
sible. Asset allocations under the plan asset management are
determined based on Toyota’s plan asset management guide-
lines which are established to achieve the optimized asset
compositions in terms of the long-term overall plan asset
management. Prior to making individual investments, Toyota
performs in-depth assessments of corresponding factors
including risks, transaction costs and liquidity of each
potential investment under consideration. To measure the
performance of the plan asset management, Toyota estab-
lishes bench mark return rates for each individual investment,
combines these individual bench mark rates based on the
asset composition ratios within each asset category, and com-
pares the combined rates with the corresponding actual
return rates on each asset category.
Toyota expects to contribute ¥98,561 million ($839 million)
to its pension plan in the year ending March 31, 2007.
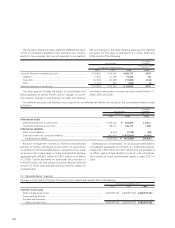
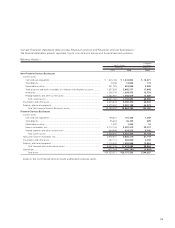
Toyota’s pension plan weighted-average asset allocations as of March 31, 2005 and 2006, by asset category are as follows:
Plan assets at
March 31,
2005 2006
Equity securities.......................................................................................................................................... 64.0% 68.2%
Debt securities............................................................................................................................................ 21.5 18.8
Real estate.................................................................................................................................................. 0.5 0.5
Other ......................................................................................................................................................... 14.0 12.5
Total .................................................................................................................................................. 100.0% 100.0%
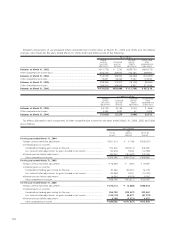
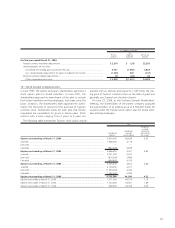
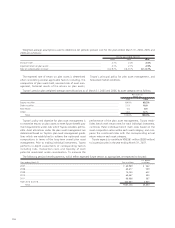
Weighted-average assumptions used to determine net periodic pension cost for the years ended March 31, 2004, 2005 and
2006 are as follows:
For the years ended March 31,
2004 2005 2006
Discount rate ................................................................................................................ 2.1% 2.2% 2.6%
Expected return on plan assets ...................................................................................... 2.1% 2.1% 2.9%
Rate of compensation increase ...................................................................................... 0.8–9.7% 0.5–9.7% 0.1–9.7%