Toyota 2006 Annual Report Download - page 36
Download and view the complete annual report
Please find page 36 of the 2006 Toyota annual report below. You can navigate through the pages in the report by either clicking on the pages listed below, or by using the keyword search tool below to find specific information within the annual report.-
 1
1 -
2
-
3
-
4
-
5
-
6
-
7
-
8
-
9
-
10
-
11
-
12
-
13
-
14
-
15
-
16
-
17
-
18
-
19
-
20
-
21
-
22
-
23
-
24
-
25
-
 26
26 -
 27
27 -
 28
28 -
 29
29 -
 30
30 -
 31
31 -
 32
32 -
 33
33 -
 34
34 -
 35
35 -
 36
36 -
 37
37 -
 38
38 -
 39
39 -
 40
40 -
 41
41 -
 42
42 -
 43
43 -
 44
44 -
 45
45 -
 46
46 -
47
-
48
-
49
-
50
-
51
-
52
-
53
-
54
-
55
-
56
-
57
-
58
-
59
-
60
-
61
-
62
-
63
-
64
-
65
-
66
-
67
-
68
-
69
-
70
-
71
-
72
-
73
-
74
-
75
-
76
-
77
-
78
-
79
-
80
-
81
-
82
-
83
-
84
-
85
-
86
-
87
-
88
-
89
-
90
-
91
-
92
-
93
-
94
-
95
-
96
-
97
-
98
-
99
-
100
-
101
-
102
-
103
-
104
-
105
-
106
-
107
-
108
-
109
-
110
-
111
-
112
-
113
-
114
-
115
-
116
-
117
-
118
-
119
-
120
-
121
-
122
-
123
-
124
-
125
-
126
-
127
-
128
-
129
-
130
-
131
-
132
-
133
-
134
-
135
-
136
-
137
-
138
-
139
-
140
 |
 |

34
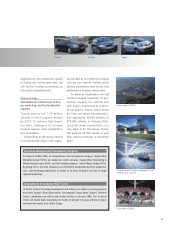
Lift Local Production Capacity to 1.98* Million by 2008
Canada (TMMC) 250,000 vehicles
Kentucky (TMMK) 500,000 vehicles
Indiana (TMMI) 300,000 vehicles
California (NUMMI)** 400,000 vehicles
Mexico (TMMBC) 50,000 vehicle
s(increase from 30,000 to 50,000 units in 2007)
Texas (TMMTX) 200,000 vehicles (scheduled for October 2006 start-up)
Canada, second plant 150,000 vehicles (scheduled for 2008 start-up)
Production outsourcing to North American
100,000 vehicles (scheduled for spring 2007 start-up)
plant of Fuji Heavy Industries Ltd.
* Toyota plans to fill the 30,000-vehicle gap relative to total plant production capacity by enhancing
efficiency and increasing personnel at existing plants.
** The California plant is a Toyota-General Motors joint venture company that is accounted for using
the equity method. Production capacity figures include vehicles for General Motors.
Note: Please see the Overseas Manufacturing Companies section on page 134 for full plant names.
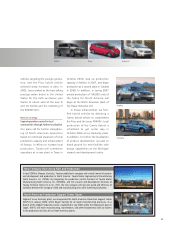
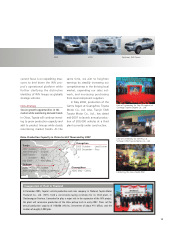
Toyota will continue to raise local production capacity while enriching
lineups in the North American market, which promises ongoing growth.
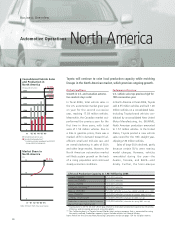
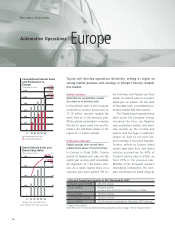
Market Conditions
Growth in U.S. and Canadian automo-
tive markets stays solid
In fiscal 2006, total vehicle sales in
the U.S. automotive market grew year
on year for the second successive
year, reaching 17.03 million vehicles.
Meanwhile, the Canadian market out-
performed the previous year for the
first time in three years, with total
sales of 1.59 million vehicles. Due to
a hike in gasoline prices, there was a
marked shift in demand toward fuel-
efficient small and mid-size cars and
an overall slackening in sales of SUVs
and other large models. However, the
North American automotive market
will likely sustain growth on the back
of a rising population and continued
steady economic conditions.
Performance Overview
U.S. vehicle sales top previous high for
10th consecutive year
In North America in fiscal 2006, Toyota
sold 2.55 million vehicles and built 1.20
million vehicles on a consolidated basis.
Including Toyota-brand vehicles con-
tributed by unconsolidated New United
Motor Manufacturing, Inc. (NUMMI),
North American production amounted
to 1.57 million vehicles. In the United
States, Toyota posted a new vehicle
sales record for the 10th straight year,
shipping 2.30 million vehicles.
Sales of large SUVs declined, partly
because certain SUVs were nearing
model changes. However, vehicles
remodeled during the year—the
Avalon, Tacoma, and RAV4—sold
briskly. Further, the Scion-marque
Business Overview
1,000
500
2,500
1,500
2,000
3,000
’02 ’03 ’04 ’05 ’06
FY
Consolidated Vehicle Sales
and Production in
North America
(Thousands of units)
Consolidated vehicle sales
Consolidated production*
* Excluding vehicles produced by NUMMI
(unconsolidated company)
0
+12.5%
+3.9%
2,556
1,201
5
10
15
CY ’01 ’02 ’03 ’04 ’05
Market Share in
North America
(%)
Note: Different from fiscal year figures
0
13.3%
Automotive Operations North America