Toyota 2006 Annual Report Download - page 16
Download and view the complete annual report
Please find page 16 of the 2006 Toyota annual report below. You can navigate through the pages in the report by either clicking on the pages listed below, or by using the keyword search tool below to find specific information within the annual report.-
 1
1 -
2
-
3
-
4
-
5
-
 6
6 -
 7
7 -
 8
8 -
 9
9 -
 10
10 -
 11
11 -
 12
12 -
 13
13 -
 14
14 -
 15
15 -
 16
16 -
 17
17 -
 18
18 -
 19
19 -
 20
20 -
 21
21 -
 22
22 -
 23
23 -
 24
24 -
 25
25 -
 26
26 -
27
-
28
-
29
-
30
-
31
-
32
-
33
-
34
-
35
-
36
-
37
-
38
-
39
-
40
-
41
-
42
-
43
-
44
-
45
-
46
-
47
-
48
-
49
-
50
-
51
-
52
-
53
-
54
-
55
-
56
-
57
-
58
-
59
-
60
-
61
-
62
-
63
-
64
-
65
-
66
-
67
-
68
-
69
-
70
-
71
-
72
-
73
-
74
-
75
-
76
-
77
-
78
-
79
-
80
-
81
-
82
-
83
-
84
-
85
-
86
-
87
-
88
-
89
-
90
-
91
-
92
-
93
-
94
-
95
-
96
-
97
-
98
-
99
-
100
-
101
-
102
-
103
-
104
-
105
-
106
-
107
-
108
-
109
-
110
-
111
-
112
-
113
-
114
-
115
-
116
-
117
-
118
-
119
-
120
-
121
-
122
-
123
-
124
-
125
-
126
-
127
-
128
-
129
-
130
-
131
-
132
-
133
-
134
-
135
-
136
-
137
-
138
-
139
-
140
 |
 |
14
Message from the Executive Vice President
Responsible for Finance & Accounting*
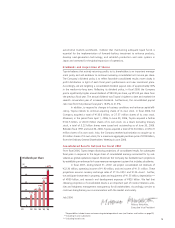
Performance Overview
In fiscal 2006, ended March 31, 2006, Toyota recorded its highest-ever revenues and
earnings, with year-on-year increases of 13.4% in consolidated net revenues, to ¥21.04
trillion; 12.3% in operating income, to ¥1.88 trillion; and 17.2% in net income, to ¥1.37
trillion. Operating income was up significantly because marketing efforts, cost reductions,
and the effect of changes in currency exchange rates counteracted increased expenses
resulting from active investment for future growth. Further, the Company was able to post
net income above ¥1 trillion for the third successive fiscal year.
In view of those results, I think we performed well in fiscal 2006. Despite increas-
ing production capacity in response to strong worldwide demand and moving forward
with the development of technologies and products for the future, Toyota achieved higher
earnings for the full year, with a strong second-half performance compensating for a
decline in income in the first half. Also, I am pleased with the progress we made toward a
globally balanced earnings structure by increasing revenues from Asia and Other Regions.
Toyota will continue targeting stable, long-term growth by enhancing its capabilities in
technology, supply, and marketing and by taking opportunities in all product segments
and regions while minimizing risks.
Financial Strategy
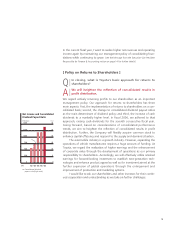
The three key strategies of Toyota’s financial strategy are Growth, Efficiency, and Stability.
We believe that the balanced pursuit of those three priorities over the medium-to-long
term will achieve steady and sustainable growth as well as increase corporate value.
1. Growth: Enhancing products, technology, and supply through continued forward-
looking investment
In our view, enhancing products to reflect market demand accurately, developing technology
to create new markets, and strengthening supply to cater to global demand require contin-
ued active investment in research and development and property, plant and equipment. In
fiscal 2006, the fruits of its forward-looking investments to date enabled Toyota to maintain
positive free cash flow while implementing investments in property, plant and equipment of
more than ¥1.5 trillion (excluding vehicles and equipment on operating leases) and recording
research and development expenses of approximately ¥810 billion. That positive free cash
flow will allow active investment for future growth in the next fiscal year.
2. Efficiency: Maintaining and enhancing profitability and capital efficiency
In fiscal 2006, Toyota’s operating income margin was 8.9% and ROE was 14.0%. In compari-
son with fiscal 2001’s operating income margin of 6.1% and ROE of 9.6%, the Company
achieved significant improvement. We will simultaneously pursue growth and efficiency and
maintain our operating income margin at approximately 9% by introducing products
efficiently through the development of core global models, advancing innovative VI Activity
cost reductions, starting up overseas plants steadily, and managing fixed costs globally.
3. Stability: Maintaining a solid financial base
Toyota maintains a solid financial base by ensuring sufficient liquidity and stable share-
holders’ equity. At fiscal 2006 year-end, liquid assets** were approximately ¥3.8 trillion
while shareholders’ equity stood at roughly ¥10.5 trillion. Toyota’s sound financial posi-
tion enables the Company to continue flexible, forward-looking investment—even during
sharp fluctuations in operating and market conditions—and underpins the high credit
ratings that give access to low-cost, stable financing. Given the expected growth in
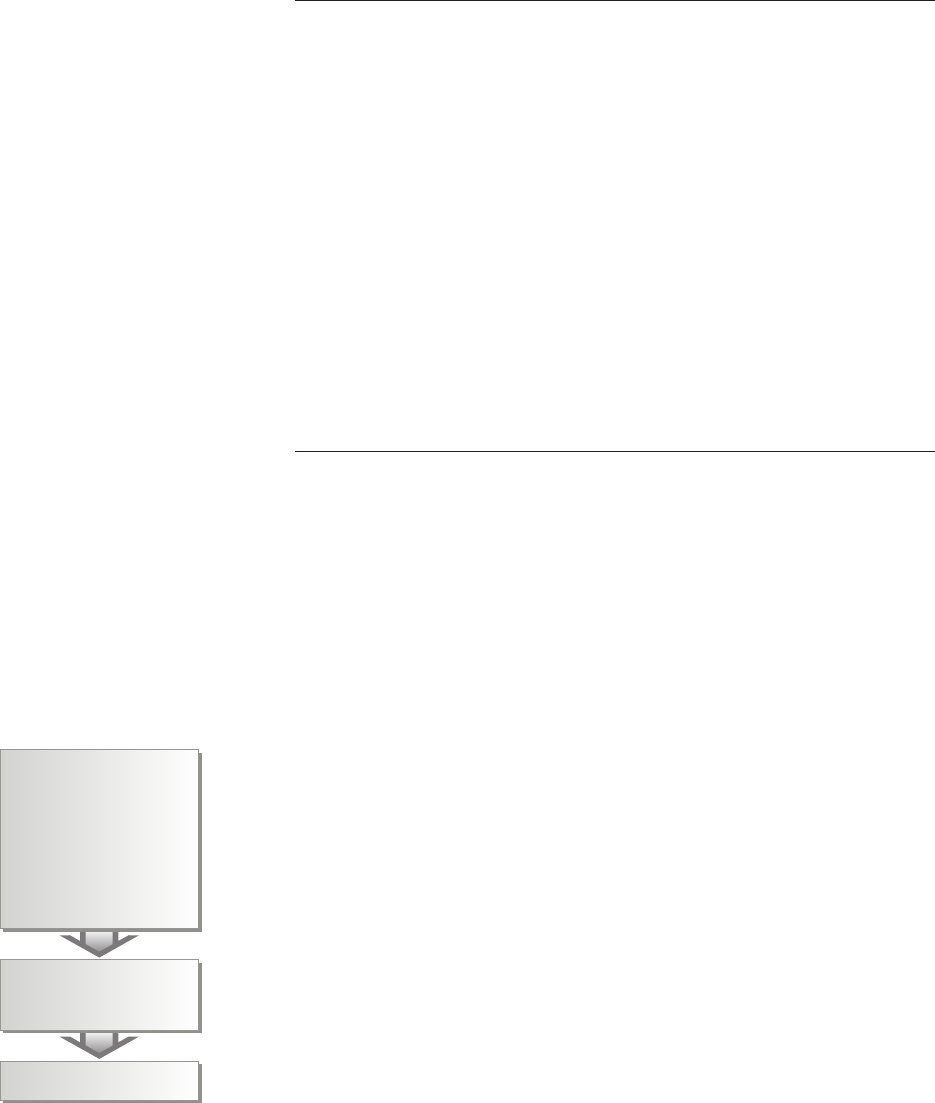
Financial Strategy
Balanced implementation
of 1. – 3. over the medium
to long term
Sustainable growth
1. Growth
2. Efficiency
Enhance profitability
and capital efficiency
3. Stability
Maintain solid financial base
Continue forward-looking
investment for growth