Toyota 2006 Annual Report Download - page 69
Download and view the complete annual report
Please find page 69 of the 2006 Toyota annual report below. You can navigate through the pages in the report by either clicking on the pages listed below, or by using the keyword search tool below to find specific information within the annual report.-
 1
1 -
2
-
3
-
4
-
5
-
6
-
7
-
8
-
9
-
10
-
11
-
12
-
13
-
14
-
15
-
16
-
17
-
18
-
19
-
20
-
21
-
22
-
23
-
24
-
25
-
26
-
27
-
28
-
29
-
30
-
31
-
32
-
33
-
34
-
35
-
36
-
37
-
38
-
39
-
40
-
41
-
42
-
43
-
44
-
45
-
46
-
47
-
48
-
49
-
50
-
51
-
52
-
53
-
54
-
55
-
56
-
57
-
58
-
 59
59 -
 60
60 -
 61
61 -
 62
62 -
 63
63 -
 64
64 -
 65
65 -
 66
66 -
 67
67 -
 68
68 -
 69
69 -
 70
70 -
 71
71 -
 72
72 -
 73
73 -
 74
74 -
 75
75 -
 76
76 -
 77
77 -
 78
78 -
 79
79 -
80
-
81
-
82
-
83
-
84
-
85
-
86
-
87
-
88
-
89
-
90
-
91
-
92
-
93
-
94
-
95
-
96
-
97
-
98
-
99
-
100
-
101
-
102
-
103
-
104
-
105
-
106
-
107
-
108
-
109
-
110
-
111
-
112
-
113
-
114
-
115
-
116
-
117
-
118
-
119
-
120
-
121
-
122
-
123
-
124
-
125
-
126
-
127
-
128
-
129
-
130
-
131
-
132
-
133
-
134
-
135
-
136
-
137
-
138
-
139
-
140
 |
 |
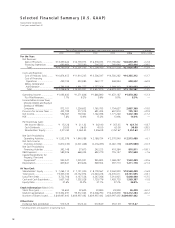
67
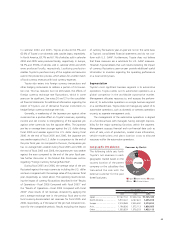
compared with the prior year. This increase primarily relates to
increased sales attributed to the housing business and the
expansion of intelligent transport systems operations.
Operating Costs and Expenses
Operating costs and expenses increased by ¥2,279.3 billion, or
13.5%, to ¥19,158.6 billion during fiscal 2006 compared with
the prior year. The increase resulted primarily from the approxi-
mate ¥1,000.0 billion impact on costs of products attributed to
vehicle unit sales growth partially offset by changes in sales mix,
a ¥587.2 billion impact of fluctuations in foreign currency trans-
lation rates, a ¥57.5 billion increase in research and develop-
ment expenses, a ¥47.2 billion decrease in net gain on the
transfer to the government of the substitutional portion of cer-
tain employee pension funds in Japan, increased expenses in
expanding business operations and increased costs related to
the corresponding increase in parts sales. These increases were
partially offset by the approximate ¥130.0 billion impact attrib-
uted to the net impact of cost reduction efforts including rise in
prices of production materials and parts in fiscal 2006.
In 2001, the Corporate Defined Benefit Pension Plan Law
was enacted and allowed a company to transfer the substitu-
tional portion of the obligation to the government. The parent
company and certain subsidiaries in Japan applied for an
exemption from the payment of benefits related to future
employee services with respect to the substitutional portion of
their employee pension funds and obtained approval from the
Minister of Health, Labour and Welfare. These companies also
applied for approval for the separation of the benefit obliga-
tions of the substitutional portion which relates to past employ-
ee services. After approval was obtained, several subsidiaries in
Japan completed the transfers of the government-specified por-
tion of plan assets relating to the substitutional portion in fiscal
2005. The gains and losses relating to these transfers were
treated in accordance with the Emerging Issues Task Force
(“EITF”) No. 03-02, Accounting for the Transfer to the Japanese
Government of the Substitutional Portion of Employee Pension
Fund Liabilities.
In connection with these transfers, for fiscal 2005, settle-
ment losses relating to the transfer of the substitutional portion
was ¥74.3 billion and was reflected in cost of products sold
(¥65.9 billion) and selling, general and administrative expenses
(¥8.4 billion). In addition, the government subsidy representing
the difference between the benefit obligations of the substitu-
tional portion and the government-specified portion of plan
assets of ¥121.5 billion for fiscal 2005 which was transferred to
the government, reduced selling, general and administrative
expenses. The net impact of this item was a reduction of oper-
ating expenses by ¥47.2 billion during fiscal 2005. See note 19
to the consolidated financial statements.
Continued cost reduction efforts reduced operating costs
and expenses in fiscal 2006 by approximately ¥130.0 billion,
partially offset by increases in the prices of steel, precious met-
als, non-ferrous alloys (e.g., aluminum), plastic parts and other
production materials and parts, over what would have other-
wise been incurred. These cost reduction efforts relate to ongo-
ing value engineering and value analysis activities, the use of
common parts that result in a reduction of part types and other
manufacturing initiatives designed to reduce the costs of vehicle
production.
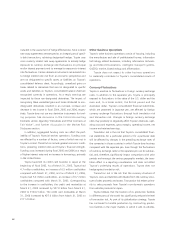
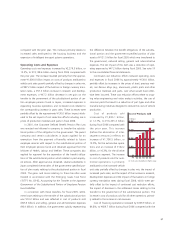
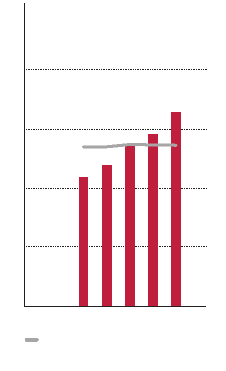
Cost of products sold
increased by ¥1,835.1 billion,
or 12.7%, to ¥16,335.3 billion
during fiscal 2006 compared with
the prior year. This increase
(before the elimination of inter-
segment amounts) reflects an
increase of ¥1,790.5 billion, or
12.9%, for the automotive opera-
tions and an increase of ¥142.2
billion, or 16.3%, for the all other
operations segment. The increase
in cost of products sold for auto-
motive operations is primarily
attributed to the increased vehicle
unit sales partially offset by changes in sales mix, the impact of
increased parts sales, and the impact of the increase in research,
development expenses and the impact of fluctuations in foreign
currency translation rates during fiscal 2006, which were par-
tially offset by the impact of continued cost reduction efforts,
the impact of decrease in the settlement losses relating to the
transfer to the government of the substitutional portion. The
increase in cost of products sold for all other operations primari-
ly related to the increase in net revenues.
Cost of financing operations increased by ¥239.9 billion, or
64.8%, to ¥609.7 billion during fiscal 2006 compared with the
10,000
5,000
15,000
20,000
’02 ’03 ’04 ’05 ’06
0
60
30
90
120
0
Cost of Products Sold
(¥ Billion) (%)
% of sales of products (Right scale)
FY