Toyota 2006 Annual Report Download - page 102
Download and view the complete annual report
Please find page 102 of the 2006 Toyota annual report below. You can navigate through the pages in the report by either clicking on the pages listed below, or by using the keyword search tool below to find specific information within the annual report.-
 1
1 -
2
-
3
-
4
-
5
-
6
-
7
-
8
-
9
-
10
-
11
-
12
-
13
-
14
-
15
-
16
-
17
-
18
-
19
-
20
-
21
-
22
-
23
-
24
-
25
-
26
-
27
-
28
-
29
-
30
-
31
-
32
-
33
-
34
-
35
-
36
-
37
-
38
-
39
-
40
-
41
-
42
-
43
-
44
-
45
-
46
-
47
-
48
-
49
-
50
-
51
-
52
-
53
-
54
-
55
-
56
-
57
-
58
-
59
-
60
-
61
-
62
-
63
-
64
-
65
-
66
-
67
-
68
-
69
-
70
-
71
-
72
-
73
-
74
-
75
-
76
-
77
-
78
-
79
-
80
-
81
-
82
-
83
-
84
-
85
-
86
-
87
-
88
-
89
-
90
-
91
-
 92
92 -
 93
93 -
 94
94 -
 95
95 -
 96
96 -
 97
97 -
 98
98 -
 99
99 -
 100
100 -
 101
101 -
 102
102 -
 103
103 -
 104
104 -
 105
105 -
 106
106 -
 107
107 -
 108
108 -
 109
109 -
 110
110 -
 111
111 -
 112
112 -
113
-
114
-
115
-
116
-
117
-
118
-
119
-
120
-
121
-
122
-
123
-
124
-
125
-
126
-
127
-
128
-
129
-
130
-
131
-
132
-
133
-
134
-
135
-
136
-
137
-
138
-
139
-
140
 |
 |

100
Expected cumulative static pool losses over the life of the
securitizations are calculated by taking actual life to date
losses plus projected losses and dividing the sum by the origi-
nal balance of each pool of assets. Expected cumulative static
pool credit losses for the retail loans securitized for the years
ended March 31, 2004, 2005 and 2006 were 0.41%, 0.40%
and 0.19%, respectively.
Toyota sold finance receivables under the program and rec-
ognized pretax gains resulting from these sales of ¥5,608 mil-
lion, ¥323 million and ¥837 million ($7 million) for the years
ended March 31, 2004, 2005 and 2006, respectively, after
providing an allowance for estimated credit losses. The gain
on sale recorded depends on the carrying amount of the
assets at the time of the sale. The carrying amount is allocated
between the assets sold and the retained interests based on
their relative fair values at the date of the sale. The key eco-
nomic assumptions initially and subsequently measuring the
fair value of retained interests include the market interest rate
environment, severity and rate of credit losses, and the
prepayment speed of the receivables. All key economic
assumptions used in the valuation of the retained interests are
reviewed periodically and are revised as considered necessary.
At March 31, 2005 and 2006, Toyota’s retained interests
relating to these securitizations include interest in trusts, inter-
est-only strips, and other receivables, amounting to ¥18,896
million and ¥18,316 million ($156 million), respectively.
Toyota recorded no impairments on retained interests for
the years ended March 31, 2004, 2005 and 2006. Those
impairments were calculated, if any, by discounting cash flows
using management’s estimates and other key economic
assumptions.
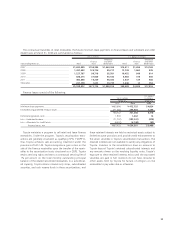
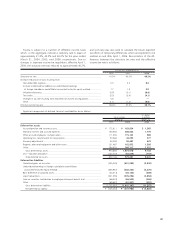
Key economic assumptions used in measuring the fair value of retained interests at the sale date of securitization transactions
completed during the years ended March 31, 2004, 2005 and 2006 were as follows:
For the years ended March 31,
2004 2005 2006
Prepayment speed related to securitizations .............................................................................. 1.0%–1.5% 0.7%–1.1% 0.7%–1.4%
Weighted-average life (in years) ................................................................................................1.70–1.85 1.85 1.72–2.06
Expected annual credit losses.................................................................................................... 0.50%–0.80% 0.30% 0.05%–0.18%
Discount rate used on the subordinated securities..................................................................... 5.0% — —
Discount rate used on other retained interests .......................................................................... 8.0%–15.0% 15.0% 5.0%
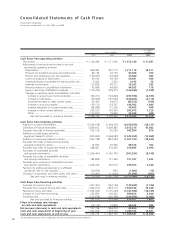
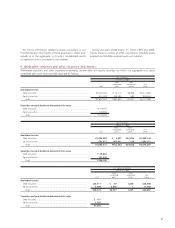
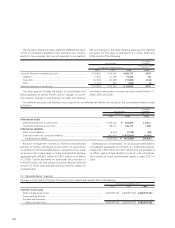
The following table summarizes certain cash flows received from and paid to the securitization trusts for the years ended
March 31, 2004, 2005 and 2006.
U.S. dollars
Yen in millions in millions
For the year ended
For the years ended March 31, March 31,
2004 2005 2006 2006
Proceeds from new securitizations, net of purchased
and retained securities......................................................................... ¥168,135 ¥ 48,958 ¥ 88,698 $755
Servicing fees received ........................................................................... 6,860 3,762 2,297 20
Excess interest received from interest only strips..................................... 20,514 9,140 4,219 36
Repurchases of receivables..................................................................... (33,614) (34,675) (50,086) (426)
Servicing advances................................................................................. (792) (215) (453) (4)
Reimbursement of servicing and maturity advances................................ 1,358 860 793 7