Toyota 2006 Annual Report Download - page 103
Download and view the complete annual report
Please find page 103 of the 2006 Toyota annual report below. You can navigate through the pages in the report by either clicking on the pages listed below, or by using the keyword search tool below to find specific information within the annual report.-
 1
1 -
2
-
3
-
4
-
5
-
6
-
7
-
8
-
9
-
10
-
11
-
12
-
13
-
14
-
15
-
16
-
17
-
18
-
19
-
20
-
21
-
22
-
23
-
24
-
25
-
26
-
27
-
28
-
29
-
30
-
31
-
32
-
33
-
34
-
35
-
36
-
37
-
38
-
39
-
40
-
41
-
42
-
43
-
44
-
45
-
46
-
47
-
48
-
49
-
50
-
51
-
52
-
53
-
54
-
55
-
56
-
57
-
58
-
59
-
60
-
61
-
62
-
63
-
64
-
65
-
66
-
67
-
68
-
69
-
70
-
71
-
72
-
73
-
74
-
75
-
76
-
77
-
78
-
79
-
80
-
81
-
82
-
83
-
84
-
85
-
86
-
87
-
88
-
89
-
90
-
91
-
92
-
 93
93 -
 94
94 -
 95
95 -
 96
96 -
 97
97 -
 98
98 -
 99
99 -
 100
100 -
 101
101 -
 102
102 -
 103
103 -
 104
104 -
 105
105 -
 106
106 -
 107
107 -
 108
108 -
 109
109 -
 110
110 -
 111
111 -
 112
112 -
 113
113 -
114
-
115
-
116
-
117
-
118
-
119
-
120
-
121
-
122
-
123
-
124
-
125
-
126
-
127
-
128
-
129
-
130
-
131
-
132
-
133
-
134
-
135
-
136
-
137
-
138
-
139
-
140
 |
 |
101
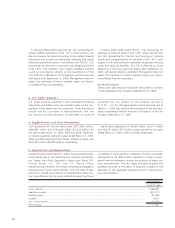
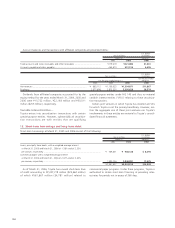
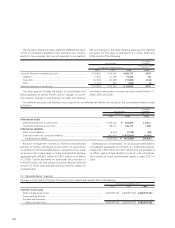
The key economic assumptions and the sensitivity of the current fair value of the retained interest to an immediate 10 and 20
percent adverse change in those economic assumptions are presented below.
U.S. dollars
Yen in millions in millions
March 31, March 31,
2006 2006
Prepayment speed assumption (annual rate) ........................................................................................... 0.7%–1.5%
Impact on fair value of 10% adverse change ....................................................................................... ¥(136) $(1)
Impact on fair value of 20% adverse change ....................................................................................... (271) (2)
Residual cash flows discount rate (annual rate)........................................................................................ 5.0%–12.0%
Impact on fair value of 10% adverse change ....................................................................................... ¥ (172) $(1)
Impact on fair value of 20% adverse change ....................................................................................... (341) (3)
Expected credit losses (annual rate)......................................................................................................... 0.05%–0.41%
Impact on fair value of 10% adverse change ....................................................................................... ¥(56) $(0)
Impact on fair value of 20% adverse change ....................................................................................... (125) (1)
These hypothetical scenarios do not reflect expected market
conditions and should not be used as a prediction of future
performance. As the figures indicate, changes in the fair value
may not be linear. Also, in this table, the effect of a variation
in a particular assumption on the fair value of the retained
interest is calculated without changing any other assumption.
Actual changes in one factor may result in changes in another,
which might magnify or counteract the sensitivities. Actual
cash flows may differ from the above analysis.
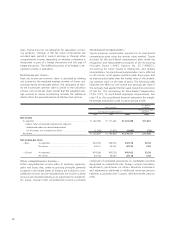
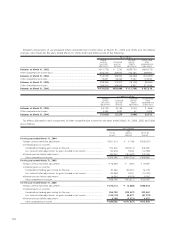
Outstanding receivable balances and delinquency amounts for managed retail and lease receivables, which include both
owned and securitized receivables, as of March 31, 2005 and 2006 are as follows:
U.S. dollars
Yen in millions in millions
March 31, March 31,
2005 2006 2006
Principal amount outstanding.............................................................................................. ¥5,520,484 ¥6,543,496 $55,704
Delinquent amounts over 60 days or more .......................................................................... 23,396 32,799 279
Comprised of:
Receivables owned .......................................................................................................... ¥5,240,276 ¥6,337,306 $53,949
Receivables securitized .................................................................................................... 280,208 206,190 1,755
Credit losses, net of recoveries attributed to managed retail and lease receivables for the years ended March 31, 2004, 2005
and 2006 totaled ¥48,011 million, ¥34,455 million and ¥46,427 million ($395 million), respectively.
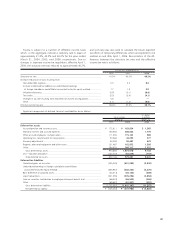
Other receivables relate to arrangements with certain component manufacturers whereby Toyota procures inventory for these
component manufacturers and is reimbursed for the related purchases.
8. Other receivables:
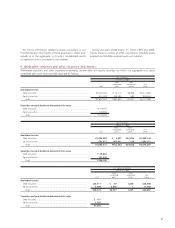
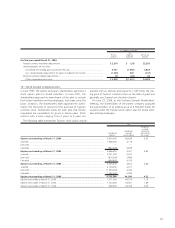
9. Inventories:
Inventories consist of the following:
U.S. dollars
Yen in millions in millions
March 31, March 31,
2005 2006 2006
Finished goods.................................................................................................................... ¥ 890,118 ¥1,097,203 $ 9,340
Raw materials...................................................................................................................... 189,675 221,285 1,884
Work in process .................................................................................................................. 179,943 239,450 2,038
Supplies and other .............................................................................................................. 46,973 63,037 537
¥1,306,709 ¥1,620,975 $13,799