Toyota 2006 Annual Report Download - page 74
Download and view the complete annual report
Please find page 74 of the 2006 Toyota annual report below. You can navigate through the pages in the report by either clicking on the pages listed below, or by using the keyword search tool below to find specific information within the annual report.-
 1
1 -
2
-
3
-
4
-
5
-
6
-
7
-
8
-
9
-
10
-
11
-
12
-
13
-
14
-
15
-
16
-
17
-
18
-
19
-
20
-
21
-
22
-
23
-
24
-
25
-
26
-
27
-
28
-
29
-
30
-
31
-
32
-
33
-
34
-
35
-
36
-
37
-
38
-
39
-
40
-
41
-
42
-
43
-
44
-
45
-
46
-
47
-
48
-
49
-
50
-
51
-
52
-
53
-
54
-
55
-
56
-
57
-
58
-
59
-
60
-
61
-
62
-
63
-
 64
64 -
 65
65 -
 66
66 -
 67
67 -
 68
68 -
 69
69 -
 70
70 -
 71
71 -
 72
72 -
 73
73 -
 74
74 -
 75
75 -
 76
76 -
 77
77 -
 78
78 -
 79
79 -
 80
80 -
 81
81 -
 82
82 -
 83
83 -
 84
84 -
85
-
86
-
87
-
88
-
89
-
90
-
91
-
92
-
93
-
94
-
95
-
96
-
97
-
98
-
99
-
100
-
101
-
102
-
103
-
104
-
105
-
106
-
107
-
108
-
109
-
110
-
111
-
112
-
113
-
114
-
115
-
116
-
117
-
118
-
119
-
120
-
121
-
122
-
123
-
124
-
125
-
126
-
127
-
128
-
129
-
130
-
131
-
132
-
133
-
134
-
135
-
136
-
137
-
138
-
139
-
140
 |
 |
72
attributed to the increased vehicle unit sales partially offset by
changes in sales mix, the impact of increased parts and service
sales, and the impact of the increase in research and develop-
ment expenses, which were partially offset by the impact of
continued cost reduction efforts, the impact of the decrease in
the settlement losses relating to the transfer to the government
of the substitutional portion and the impact of fluctuations in
foreign currency translation rates during fiscal 2005. The
increase in cost of products sold for all other operations primari-
ly related to the increase in net revenues.
Cost of financing operations increased by ¥5.7 billion, or
1.6%, to ¥369.8 billion during fiscal 2005 compared with the
prior year. The increase resulted primarily from the impact of
increased interest expenses caused primarily by higher interest
rates and an increase in borrowings attributed to business
expansion in the United States, that was partially offset by the
impact of an increase in net gains on derivative financial instru-
ments that are not designated as hedges and are marked-to-
market at the end of each period and lower provisions for the
allowance for residual value losses due to a decline in the return
rate of leased vehicles.
Selling, general and administrative expenses increased by
¥251.9 billion, or 14.3%, to ¥2,009.2 billion during fiscal 2005
compared with the prior year. This increase (before the elimina-
tion of intersegment amounts) reflects an increase of ¥324.5
billion, or 21.8%, for the automotive operations, a decrease of
¥20.9 billion, or 9.3%, for the financial services operations and
an increase of ¥3.0 billion, or 2.5%, for all other operations seg-
ment. The increase for the automotive operations consisted pri-
marily of the impact from the reduction of gains attributed to
the transfer of the substitutional portion of certain employee
pension funds to the government and the impact of increased
expenses in expanding business operations, which were partially
offset by the impact of fluctuations in foreign currency transla-
tion rates. The decrease for the financial services operations
reflects lower provisions for credit losses specifically in North
America due to an improvement in the delinquent loan collec-
tion rate and the impact of fluctuations in foreign currency
translation rates.
Research and development expenses (included in cost of
products sales and selling, general and administrative expenses)
increased by ¥72.9 billion, or 10.7%, to ¥755.1 billion during
fiscal 2005 compared with the prior year. This increase primarily
relates to expenditures attributed to the development of envi-
ronmentally conscious technologies including hybrid and fuel
cell battery technology, aggressive developments in advanced
technologies relating to collision safety and vehicle stability con-
trols and the impact of expanding new models to promote
Toyota’s strength in a competitive global market to further build
up strength in future.
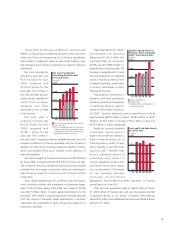
Operating Income
Toyota’s operating income increased by ¥5.3 billion, or 0.3%,
to ¥1,672.1 billion during fiscal 2005 compared with the prior
year. Operating income was favorably affected by the vehicle
unit sales growth partially offset by changes in sales mix, the
impact of increased parts and service sales, continued cost
reduction efforts, growth in the financial services operations
and improvements in all other operations. These increases were
partially offset by a reduction in the net gains on the transfer to
the government of the substitutional portion of certain employ-
ee pension funds, increases in research and development
expenses, the impact of business expansion and the unfavorable
impact of fluctuations in foreign currency translation rates. As a
result, operating income decreased to 9.0% as a percentage of
net revenues for fiscal 2005 compared to 9.6% in the prior year.
During fiscal 2005, operating income (before the elimina-
tion of intersegment profits) by significant geographies resulted
in a decrease of ¥120.9 billion, or 10.9%, in Japan, and increas-
es of ¥56.5 billion, or 14.5%, in North America, ¥36.0 billion,
or 49.8% in Europe, ¥33.5 billion, or 55.6% in Asia and ¥10.8
billion, or 29.5% in Other compared with the prior year. The
decrease in Japan relates primarily to the impact of a decrease
in the net gains relating to the transfer to the government of
the substitutional portion of certain employee funds, increases
in research and development expenses and the unfavorable
impact of fluctuations in foreign currency translation rates. The
decrease was partially offset by the vehicle unit sales growth in
both of the domestic and export markets partially offset by
changes in sales mix and continued cost reduction efforts. The
increase in North America relates primarily to the increase in
production volume and vehicle unit sales, the impact of cost
reduction efforts in the manufacturing operations, increases in
the asset base of the financial services operations, and lower
provisions for credit losses and the allowance for residual value
losses which were partially offset by an increase in expenses