TCF Bank 2009 Annual Report Download - page 70
Download and view the complete annual report
Please find page 70 of the 2009 TCF Bank annual report below. You can navigate through the pages in the report by either clicking on the pages listed below, or by using the keyword search tool below to find specific information within the annual report.-
 1
1 -
2
-
3
-
4
-
5
-
6
-
7
-
8
-
9
-
10
-
11
-
12
-
13
-
14
-
15
-
16
-
17
-
18
-
19
-
20
-
21
-
22
-
23
-
24
-
25
-
26
-
27
-
28
-
29
-
30
-
31
-
32
-
33
-
34
-
35
-
36
-
37
-
38
-
39
-
40
-
41
-
42
-
43
-
44
-
45
-
46
-
47
-
48
-
49
-
50
-
51
-
52
-
53
-
54
-
55
-
56
-
57
-
58
-
59
-
 60
60 -
 61
61 -
 62
62 -
 63
63 -
 64
64 -
 65
65 -
 66
66 -
 67
67 -
 68
68 -
 69
69 -
 70
70 -
 71
71 -
 72
72 -
 73
73 -
 74
74 -
 75
75 -
 76
76 -
 77
77 -
 78
78 -
 79
79 -
 80
80 -
81
-
82
-
83
-
84
-
85
-
86
-
87
-
88
-
89
-
90
-
91
-
92
-
93
-
94
-
95
-
96
-
97
-
98
-
99
-
100
-
101
-
102
-
103
-
104
-
105
-
106
-
107
-
108
-
109
-
110
-
111
-
112
-
113
-
114
 |
 |

54 : TCF Financial Corporation and Subsidiaries
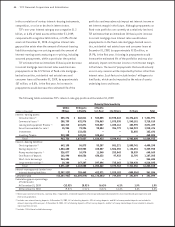
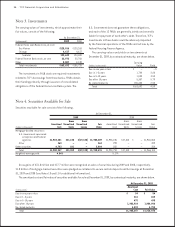
Note 3. Investments
The carrying values of investments, which approximate their
fair values, consist of the following.
At December 31,
(In thousands) 2008
Federal Home Loan Bank stock, at cost:
Des Moines $120,263
Chicago 4,617
Subtotal 124,880
Federal Reserve Bank stock, at cost 22,706
Other 8,139
Total investments $155,725
The investments in FHLB stock are required investments
related to TCF’s borrowings from these banks. FHLBs obtain
their funding primarily through issuance of consolidated
obligations of the Federal Home Loan Bank system. The
U.S. Government does not guarantee these obligations,
and each of the 12 FHLBs are generally jointly and severally
liable for repayment of each other’s debt. Therefore, TCF’s
investments in these banks could be adversely impacted
by the nancial operations of the FHLBs and actions by the
Federal Housing Finance Agency.
The carrying values and yields on investments at
December 31, 2009, by contractual maturity, are shown below.
Carrying
(Dollars in thousands) Value Yield
Due in one year or less $ – –%
Due in 1-5 years 1,700 2.88
Due in 5-10 years 1,000 3.50
Due after 10 years 5,387 5.79
No stated maturity 155,605 2.53
Total $163,692 4.89
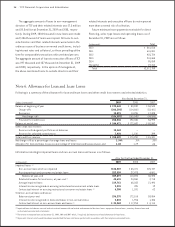
Note 4. Securities Available for Sale
Securities available for sale consist of the following.
At December 31,
2008
Gross Gross
Amortized Unrealized Unrealized Fair
(Dollars in thousands) Cost Gains Losses Value
Mortgage-backed securities:
U.S. Government sponsored
enterprises and federal
agencies $1,928,245 $37,310 $ – $1,965,555
Other 299 – – 299
Other securities 250 – – 250
Total $1,928,794 $37,310 $ – $1,966,104
Weighted-average yield 5.17%
Gross gains of $31.8 million and $17.7 million were recognized on sales of securities during 2009 and 2008, respectively.
$1.8 billion of mortgage-backed securities were pledged as collateral to secure certain deposits and borrowings at December
31, 2009 and 2008 (see Notes 10 and 11 for additional information).
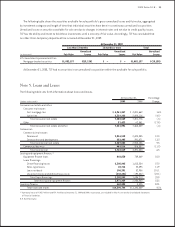
The amortized cost and fair value of securities available for sale at December 31, 2009, by contractual maturity, are shown below.
(In thousands)
Due in one year or less
Due in 1-5 years
Due in 5-10 years
Due after 10 years
No stated maturity
Total