TCF Bank 2009 Annual Report Download - page 41
Download and view the complete annual report
Please find page 41 of the 2009 TCF Bank annual report below. You can navigate through the pages in the report by either clicking on the pages listed below, or by using the keyword search tool below to find specific information within the annual report.-
 1
1 -
2
-
3
-
4
-
5
-
6
-
7
-
8
-
9
-
10
-
11
-
12
-
13
-
14
-
15
-
16
-
17
-
18
-
19
-
20
-
21
-
22
-
23
-
24
-
25
-
26
-
27
-
28
-
29
-
30
-
 31
31 -
 32
32 -
 33
33 -
 34
34 -
 35
35 -
 36
36 -
 37
37 -
 38
38 -
 39
39 -
 40
40 -
 41
41 -
 42
42 -
 43
43 -
 44
44 -
 45
45 -
 46
46 -
 47
47 -
 48
48 -
 49
49 -
 50
50 -
 51
51 -
52
-
53
-
54
-
55
-
56
-
57
-
58
-
59
-
60
-
61
-
62
-
63
-
64
-
65
-
66
-
67
-
68
-
69
-
70
-
71
-
72
-
73
-
74
-
75
-
76
-
77
-
78
-
79
-
80
-
81
-
82
-
83
-
84
-
85
-
86
-
87
-
88
-
89
-
90
-
91
-
92
-
93
-
94
-
95
-
96
-
97
-
98
-
99
-
100
-
101
-
102
-
103
-
104
-
105
-
106
-
107
-
108
-
109
-
110
-
111
-
112
-
113
-
114
 |
 |

2009 Form 10-K : 25
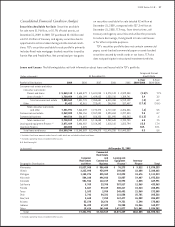
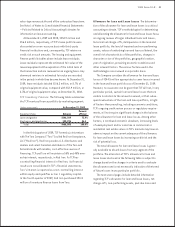
Gains on Securities, Net In 2009, net gains of $29.4
million were recognized on sales of $2.1 billion in mortgage-
backed securities and agency debentures. In 2008, gains
of $16.1 million were recognized on sales of $1.5 billion in
mortgage-backed securities and $174.9 million in treasury
bills. In 2007, gains of $13.3 million were recognized on the
sales of $1.2 billion in mortgage-backed securities.
Gains on Sales of Branches and Real Estate There
were no gains on sales of branches and real estate in 2009
or 2008. Gains on sales of branches and real estate were
$37.9 million for 2007. During the rst quarter of 2007, TCF
sold the deposits and facilities of 10 out-state branches in
Michigan and recognized a $31.2 million gain.
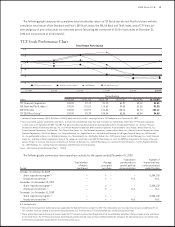
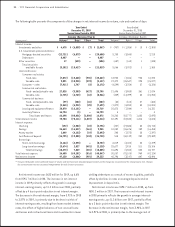
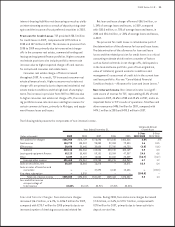
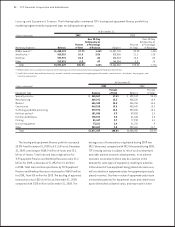
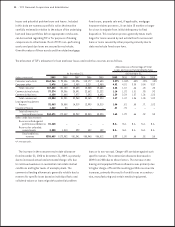
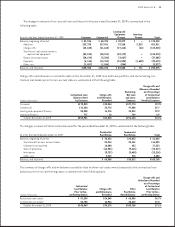
Non-interest expense increased $64.7 million, or 9.5%, in 2009, and $43.9 million, or 6.9%, in 2008,
excluding the Visa indemnication expense and operating lease depreciation. The following table presents the components of
non-interest expense.
Compound Annual
Year Ended December 31, Growth Rate
5-Year
(Dollars in thousands) 2008 2007 2006 2005 2009/2004
Compensation and employee benets $341,203 $346,468 $341,857 $326,526 2.0%
Occupancy and equipment 127,953 120,824 114,618 103,900 5.7
Deposit account premiums 16,888 4,849 5,047 5,822 27.9
Foreclosed real estate and
repossessed assets, net 18,731 5,558 4,068 2,466 135.0
FDIC premiums and assessments 2,990 1,145 1,139 1,080 89.7
Advertising and marketing 19,150 16,829 21,879 19,869 (.3)
Other 153,796 141,167 146,242 139,937 3.7
Subtotal 680,711 636,840 634,850 599,600 5.3
Operating lease depreciation 17,458 17,588 14,347 7,335 64.7
Visa indemnication expense (3,766) 7,696 – – –
Total non-interest expense $694,403 $662,124 $649,197 $606,935 5.8
N.M. Not Meaningful.
Compensation and Employee Benefits Compensation
and employee benets represented 46.5%, 49.1% and
52.3% of total non-interest expense in 2009, 2008 and
2007, respectively. Compensation and employee benets
increased $15.8 million, or 4.6%, in 2009, compared with
a decrease of $5.3 million, or 1.5%, in 2008. The increases
in compensation and benets in 2009 were primarily due
to increases in leasing and equipment nance and the
inventory nance compensation costs as a result of
expansion and growth and increased employee medical
plan expenses. The decreases in compensation and benets
in 2008 was primarily due to headcount reductions, decreased
performance-based compensation as no executive bonuses
were paid in 2008 and lower benet related costs, partially
offset by expenses from branch expansion and the new
inventory nance business.
Occupancy and Equipment Occupancy and equipment
expenses decreased $1.7 million in 2009 and increased
$7.1 million in 2008. The decrease in 2009 was primarily
due to the closing of six branches. The increase in 2008 was
primarily due to costs associated with branch expansion
and increased real estate taxes.
Deposit Account Premiums Deposit account premium
expense increased $13.8 million to $30.7 million in 2009 and
increased $12 million to $16.9 million in 2008. The increases
in deposit account premium expenses were primarily due to
successful marketing campaigns commencing in June of 2008
which have resulted in increased checking account produc-
tion. New checking accounts grew 24.4% in 2009 compared
with 2008.
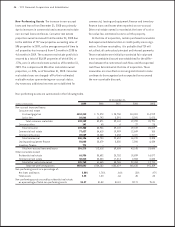
Foreclosed Real Estate and Repossessed Assets
Foreclosed real estate and repossessed assets expense
totaled $30.5 million in 2009, compared to $18.7 million
in 2008 and $5.6 million in 2007. The increase in 2009 was
primarily due to the increased number of foreclosed
consumer and commercial real estate properties and
property valuation write-downs.