TCF Bank 2009 Annual Report Download - page 38
Download and view the complete annual report
Please find page 38 of the 2009 TCF Bank annual report below. You can navigate through the pages in the report by either clicking on the pages listed below, or by using the keyword search tool below to find specific information within the annual report.-
 1
1 -
2
-
3
-
4
-
5
-
6
-
7
-
8
-
9
-
10
-
11
-
12
-
13
-
14
-
15
-
16
-
17
-
18
-
19
-
20
-
21
-
22
-
23
-
24
-
25
-
26
-
27
-
 28
28 -
 29
29 -
 30
30 -
 31
31 -
 32
32 -
 33
33 -
 34
34 -
 35
35 -
 36
36 -
 37
37 -
 38
38 -
 39
39 -
 40
40 -
 41
41 -
 42
42 -
 43
43 -
 44
44 -
 45
45 -
 46
46 -
 47
47 -
 48
48 -
49
-
50
-
51
-
52
-
53
-
54
-
55
-
56
-
57
-
58
-
59
-
60
-
61
-
62
-
63
-
64
-
65
-
66
-
67
-
68
-
69
-
70
-
71
-
72
-
73
-
74
-
75
-
76
-
77
-
78
-
79
-
80
-
81
-
82
-
83
-
84
-
85
-
86
-
87
-
88
-
89
-
90
-
91
-
92
-
93
-
94
-
95
-
96
-
97
-
98
-
99
-
100
-
101
-
102
-
103
-
104
-
105
-
106
-
107
-
108
-
109
-
110
-
111
-
112
-
113
-
114
 |
 |

22 : TCF Financial Corporation and Subsidiaries
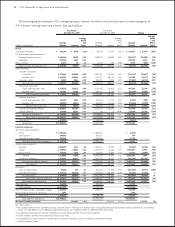
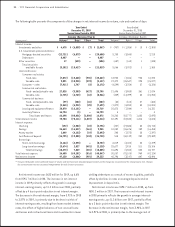
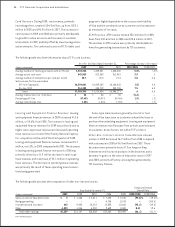
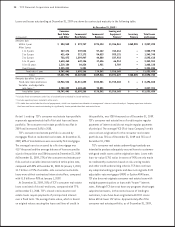
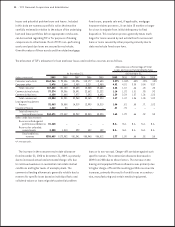
The following table presents the components of the changes in net interest income by volume, rate and number of days.
Year Ended
December 31, 2008
Versus Same Period in 2007
Increase (Decrease) Due to
(In thousands) (1) (1) Volume(1) Rate(1) # Days Total
Interest income:
Investments and other $ (957) $(1,356) $13 $(2,300)
U.S. Government sponsored entities:
Mortgage-backed securities 5,753 (3,540) – 2,213
Debentures – – – –
Other securities (687) (162) 1 (848)
Total securities
available for sale 5,066 (3,702) 1 1,365
Loans and leases:
Consumer real estate:
Fixed-rate 18,925 (7,656) 954 12,223
Variable-rate 19,372 (35,547) 298 (15,877)
Consumer – other (4,599) (3,754) 27 (8,326)
Commercial real estate:
Fixed- and adjustable-rate 21,496 (3,983) 361 17,874
Variable-rate (839) (14,499) 85 (15,253)
Commercial business:
Fixed- and adjustable-rate (80) (812) 27 (865)
Variable-rate (1,872) (8,982) 50 (10,804)
Leasing and equipment nance 25,875 (7,544) – 18,331
Inventory nance 4 – – 4
Total loans and leases 78,282 (82,777) 1,802 (2,693)
Total interest income 82,391 (87,835) 1,816 (3,628)
Interest expense:
Checking (857) (19,888) 35 (20,710)
Savings 10,082 (26,676) 139 (16,455)
Money market 248 (7,573) 28 (7,297)
Certicates of deposit 518 (30,139) 232 (29,389)
Borrowings:
Short-term borrowings 6,019 (8,422) 24 (2,379)
Long-term borrowings 25,677 2,918 511 29,106
Total borrowings 31,696 (5,504) 535 26,727
Total interest expense 30,007 (78,100) 969 (47,124)
Net interest income 45,796 (3,147) 847 43,496
(1) Changes attributable to the combined impact of volume and rate have been allocated proportionately to the change due to volume and the change due to rate. Changes
due to volume and rate are calculated independently for each line item presented.
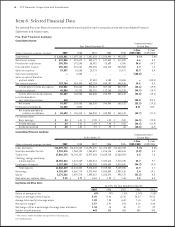
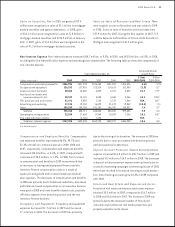
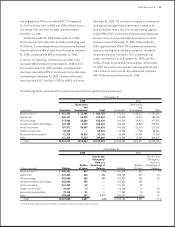
Net interest income was $633 million for 2009, up 6.6%
from $593.7 million in 2008. The increase in net interest
income in 2009 primarily reects the growth in average
interest-earning assets, up $1.2 billion over 2008, partially
offset by a 4 basis point reduction in net interest margin.
The decrease in the net interest margin, from 3.91% in 2008
to 3.87% in 2009, is primarily due to declines in yields of
interest earning assets, resulting from lower market interest
rates, the effect of higher balances of non-accrual loans
and leases and restructured loans and investments in lower
yielding debentures as a result of excess liquidity, partially
offset by declines in rates on average deposits and an
improvement in deposit mix.
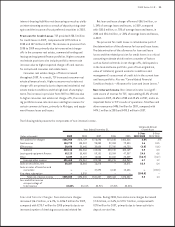
Net interest income was $593.7 million in 2008, up from
$550.2 million in 2007. The increase in net interest income
in 2008 primarily reects the growth in average interest-
earning assets, up $1.2 billion over 2007, partially offset
by a 3 basis point reduction in net interest margin. The
decrease in the net interest margin, from 3.94% in 2007
to 3.91% in 2008, is primarily due to the average cost of