TCF Bank 2009 Annual Report Download - page 35
Download and view the complete annual report
Please find page 35 of the 2009 TCF Bank annual report below. You can navigate through the pages in the report by either clicking on the pages listed below, or by using the keyword search tool below to find specific information within the annual report.-
 1
1 -
2
-
3
-
4
-
5
-
6
-
7
-
8
-
9
-
10
-
11
-
12
-
13
-
14
-
15
-
16
-
17
-
18
-
19
-
20
-
21
-
22
-
23
-
24
-
 25
25 -
 26
26 -
 27
27 -
 28
28 -
 29
29 -
 30
30 -
 31
31 -
 32
32 -
 33
33 -
 34
34 -
 35
35 -
 36
36 -
 37
37 -
 38
38 -
 39
39 -
 40
40 -
 41
41 -
 42
42 -
 43
43 -
 44
44 -
 45
45 -
46
-
47
-
48
-
49
-
50
-
51
-
52
-
53
-
54
-
55
-
56
-
57
-
58
-
59
-
60
-
61
-
62
-
63
-
64
-
65
-
66
-
67
-
68
-
69
-
70
-
71
-
72
-
73
-
74
-
75
-
76
-
77
-
78
-
79
-
80
-
81
-
82
-
83
-
84
-
85
-
86
-
87
-
88
-
89
-
90
-
91
-
92
-
93
-
94
-
95
-
96
-
97
-
98
-
99
-
100
-
101
-
102
-
103
-
104
-
105
-
106
-
107
-
108
-
109
-
110
-
111
-
112
-
113
-
114
 |
 |

2009 Form 10-K : 19
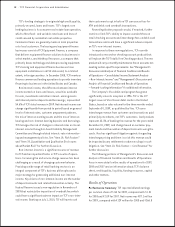
million for 2007. Net income for 2009 includes a non-cash
deemed preferred stock dividend of $12 million, or
10 cents per common share. Net income for 2007 included
$37.9 million in pre-tax gains on sales of branches and
real estate.
Return on average assets was .49% in 2009, compared
with .79% in 2008 and 1.76% in 2007. Return on average
common equity was 5.95% in 2009, compared with 11.46%
in 2008 and 25.82% in 2007. The effective income tax rate
for 2009 was 34.6%, compared with 37.3% in 2008 and
28.4% in 2007.
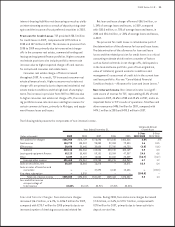
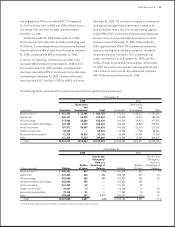
RETAIL BANKING — Consisting
of retail lending and branch banking, reported net income
of $26.6 million for 2009, down 57% from $61.9 million
in 2008 as a result of higher provision and losses on
consumer real estate loans. Retail Banking net interest
income for 2009 was $403.2 million, up 6.5% from $378.7
million for 2008.
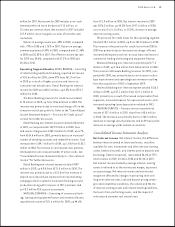
The Retail Banking provision for credit losses totaled
$178 million in 2009, up from $136.6 million in 2008. This
increase was primarily due to increased charge-offs in the
consumer real estate portfolio. Refer to the “Consolidated
Income Statement Analysis — Provision for Credit Losses”
section for further discussion.
Retail Banking non-interest income totaled $418 million
in 2009, as compared with $419.9 million in 2008. Fees
and service charges were $282.3 million for 2009, up 6.7%
from $264.6 million in 2008, primarily due to an increased
number of checking accounts and related fee income. Card
revenues were $104.7 million for 2009, up 1.6% from $103.1
million in 2008. The increase in card revenues was primarily
attributable to an increased number of active cards. See
“Consolidated Income Statement Analysis — Non-Interest
Income” for further discussion.
Retail Banking non-interest expense totaled $599
million in 2009, up 4.8% from $571.8 million in 2008. The
increase was primarily due to a $13.8 million increase in
deposit account premium expenses from new marketing
campaigns which resulted in increased checking account
production along with increases in FDIC premiums and
an $8.2 million FDIC special assessment.
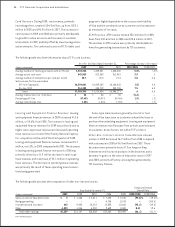
WHOLESALE BANKING — Consisting of commercial bank-
ing, leasing and equipment nance and inventory nance,
reported net income of $31.6 million for 2009, up 44.6%
from $21.9 million in 2008. Net interest income for 2009
was $206.3 million, up 40.2% from $147.1 million in 2008,
as a result of a $1.1 billion, or 19.8%, increase in average
interest-earning assets.
The provision for credit losses for this operating segment
totaled $78.7 million in 2009, up from $52.8 million in 2008.
The increase in the provision for credit losses from 2008 to
2009 was primarily due to increased net charge-offs and
increased delinquency and non-accrual loans and leases in
commercial lending and leasing and equipment nance.
Wholesale Banking non-interest income totaled $77.2
million in 2009, up $16.6 million from $60.6 million in 2008.
The increase in Wholesale Banking revenues for 2009, com-
pared with 2008, was primarily due to an increase in sales-
type lease revenue and operating lease revenues resulting
from the acquisition of FNCI in September 2009.
Wholesale Banking non-interest expense totaled $156.2
million in 2009, up $37.1 million from $119.1 million in
2008, primarily as a result of increased compensation from
expansion, increased expense for repossessed assets, and
increased operating lease depreciation related to FNCI.
TREASURY SERVICES — Treasury services reported net
income of $27.4 million in 2009, down from $48.6 million
in 2008. The decrease was primarily due to a $60.6 million
decrease in average security balances and an 89 basis point
decrease in average yields earned on securities.
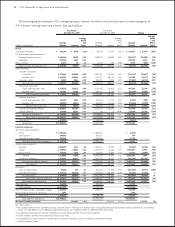
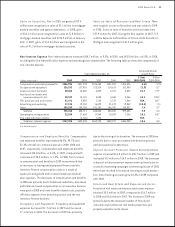
Consolidated Income Statement Analysis
Net interest income, the difference
between interest earned on loans and leases, securities
available for sale, investments and other interest-earning
assets (interest income), and interest paid on deposits and
borrowings (interest expense), represented 54.6% of TCF’s
total revenue in 2009, 54.4% in 2008 and 50.4% in 2007.
Net interest income divided by average interest-earning
assets is referred to as the net interest margin, expressed
as a percentage. Net interest income and net interest
margin are affected by changes in prevailing short and
long-term interest rates, loan and deposit pricing strate-
gies and competitive conditions, the volume and the mix
of interest-earning assets and interest-bearing liabilities,
the level of non-performing assets, and the impact of
restructured consumer real estate loans.