TCF Bank 2009 Annual Report Download - page 32
Download and view the complete annual report
Please find page 32 of the 2009 TCF Bank annual report below. You can navigate through the pages in the report by either clicking on the pages listed below, or by using the keyword search tool below to find specific information within the annual report.-
 1
1 -
2
-
3
-
4
-
5
-
6
-
7
-
8
-
9
-
10
-
11
-
12
-
13
-
14
-
15
-
16
-
17
-
18
-
19
-
20
-
21
-
 22
22 -
 23
23 -
 24
24 -
 25
25 -
 26
26 -
 27
27 -
 28
28 -
 29
29 -
 30
30 -
 31
31 -
 32
32 -
 33
33 -
 34
34 -
 35
35 -
 36
36 -
 37
37 -
 38
38 -
 39
39 -
 40
40 -
 41
41 -
 42
42 -
43
-
44
-
45
-
46
-
47
-
48
-
49
-
50
-
51
-
52
-
53
-
54
-
55
-
56
-
57
-
58
-
59
-
60
-
61
-
62
-
63
-
64
-
65
-
66
-
67
-
68
-
69
-
70
-
71
-
72
-
73
-
74
-
75
-
76
-
77
-
78
-
79
-
80
-
81
-
82
-
83
-
84
-
85
-
86
-
87
-
88
-
89
-
90
-
91
-
92
-
93
-
94
-
95
-
96
-
97
-
98
-
99
-
100
-
101
-
102
-
103
-
104
-
105
-
106
-
107
-
108
-
109
-
110
-
111
-
112
-
113
-
114
 |
 |

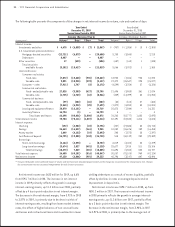
16 : TCF Financial Corporation and Subsidiaries
Compound Annual
Year Ended December 31, Growth Rate
5-Year
(Dollars in thousands, except per-share data) 2008 2007 2006 2005 2009/2004
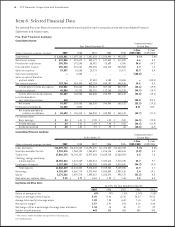
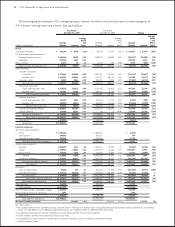
Total revenue $ 1,092,108 $ 1,091,634 $ 1,026,994 $ 995,932 3.4%
Net interest income $ 593,673 $ 550,177 $ 537,530 $ 517,690 5.2
Provision for credit losses 192,045 56,992 20,689 8,586 69.2
Fees and other revenue 474,061 490,285 485,276 453,965 1.2
Gains on securities 16,066 13,278 – 10,671 5.4
Visa share redemption 8,308 – – – –
Gains on sales of branches
and real estate – 37,894 4,188 13,606 (100.0)
Non-interest expense 694,403 662,124 649,197 606,936 5.8
Income before income tax expense 205,660 372,518 357,108 380,410 (19.2)
Income tax expense 76,702 105,710 112,165 115,278 (18.7)
Income after income tax expense 128,958 266,808 244,943 265,132 (19.4)
Loss attributable to
non-controlling interest – – – – 100.0
Net income 128,958 266,808 244,943 265,132 (19.3)
Preferred stock dividends 2,540 – – – N.M.
Net income available to
common stockholders $ 126,418 $ 266,808 $ 244,943 $ 265,132 (21.3)
Per common share:
Basic earnings $ 1.01 $ 2.09 $ 1.90 $ 2.00 (22.0)
Diluted earnings $ 1.01 $ 2.09 $ 1.90 $ 2.00 (21.9)
Dividends declared $ 1.00 $ .97 $ .92 $ .85 (6.4)
Compound Annual
At December 31, Growth Rate
5-Year
(Dollars in thousands, except per-share data) 2008 2007 2006 2005 2009/2004
Loans and leases $13,345,889 $12,494,370 $11,478,255 $10,443,033 8.8%
Securities available for sale 1,966,104 1,963,681 1,816,126 1,648,615 3.4
Total assets 16,740,357 15,977,054 14,669,734 13,388,594 7.6
Checking, savings and money
market deposits 7,647,069 7,322,014 7,285,615 7,213,735 9.7
Certicates of deposit 2,596,283 2,254,535 2,483,635 1,915,620 (4.2)
Total deposits 10,243,352 9,576,549 9,769,250 9,129,355 7.7
Borrowings 4,660,774 4,973,448 3,588,540 2,983,136 14.1
Equity 1,493,776 1,099,012 1,033,374 998,472 4.2
Book value per common share $ 8.99 $ 8.68 $ 7.92 $ 7.46 5.4
At or For the Year Ended December 31,
2008 2007 2006 2005
Return on average assets .79% 1.76% 1.74% 2.08%
Return on average common equity 11.46 25.82 24.37 28.03
Average total equity to average assets 7.04 6.82 7.15 7.43
Net interest margin(1) 3.91 3.94 4.16 4.46
Net charge-offs as a percentage of average loans and leases .78 .30 .17 .29
Number of bank branches 448 453 453 453
(1) Net interest income divided by average interest-earning assets.
N.M. Not Meaningful.
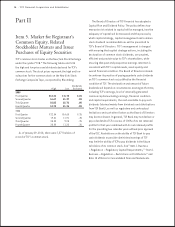
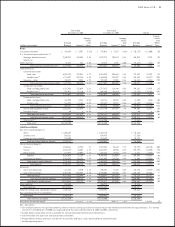
Item 6. Selected Financial Data
The selected ve-year nancial summary presented below should be read in conjunction with the Consolidated Financial
Statements and related notes.