TCF Bank 2009 Annual Report Download - page 45
Download and view the complete annual report
Please find page 45 of the 2009 TCF Bank annual report below. You can navigate through the pages in the report by either clicking on the pages listed below, or by using the keyword search tool below to find specific information within the annual report.-
 1
1 -
2
-
3
-
4
-
5
-
6
-
7
-
8
-
9
-
10
-
11
-
12
-
13
-
14
-
15
-
16
-
17
-
18
-
19
-
20
-
21
-
22
-
23
-
24
-
25
-
26
-
27
-
28
-
29
-
30
-
31
-
32
-
33
-
34
-
 35
35 -
 36
36 -
 37
37 -
 38
38 -
 39
39 -
 40
40 -
 41
41 -
 42
42 -
 43
43 -
 44
44 -
 45
45 -
 46
46 -
 47
47 -
 48
48 -
 49
49 -
 50
50 -
 51
51 -
 52
52 -
 53
53 -
 54
54 -
 55
55 -
56
-
57
-
58
-
59
-
60
-
61
-
62
-
63
-
64
-
65
-
66
-
67
-
68
-
69
-
70
-
71
-
72
-
73
-
74
-
75
-
76
-
77
-
78
-
79
-
80
-
81
-
82
-
83
-
84
-
85
-
86
-
87
-
88
-
89
-
90
-
91
-
92
-
93
-
94
-
95
-
96
-
97
-
98
-
99
-
100
-
101
-
102
-
103
-
104
-
105
-
106
-
107
-
108
-
109
-
110
-
111
-
112
-
113
-
114
 |
 |

2009 Form 10-K : 29
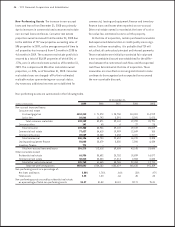
was originated at FICO scores below 620. TCF originated
$1.9 billion of new loans in 2008 and 2009; of these loans,
net charge-offs over the last eight quarters totaled
$4 million, or .10%.
At both December 31, 2009 and December 31, 2008,
total consumer real estate lines of credit outstanding were
$2.2 billion. Outstanding balances on consumer real estate
lines of credit were 58% of total lines of credit at December
31, 2009, compared with 55% at December 31, 2008.
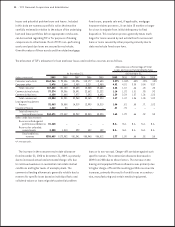
Commercial Banking Commercial real estate loans
increased $284.8 million from December 31, 2008 to $3.3
billion at December 31, 2009. Variable- and adjustable-
rate loans represented 47% of commercial real estate loans
outstanding at December 31, 2009. Commercial business
loans decreased $57.4 million in 2009 to $449.5 million at
December 31, 2009. TCF continues to expand its commercial
lending activities generally to borrowers located in its
primary markets. With a focus on secured lending, approxi-
mately 99% of TCF’s commercial real estate and commercial
business loans were secured either by properties or other
business assets at December 31, 2009. At December 31,
2009, approximately 92% of TCF’s commercial real estate
loans outstanding were secured by properties located in
its primary markets. Included in TCF’s commercial real
estate loan portfolio as of December 31, 2009, are $32.1
million of loans to residential home builders. At December
31, 2009, the construction and development portfolio had
$13.1 million in loans over 30-days delinquent compared
with $223 thousand at December 31, 2008.
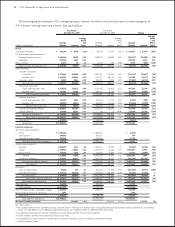
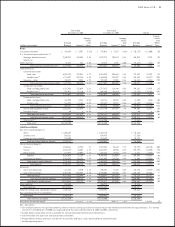
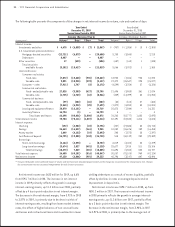
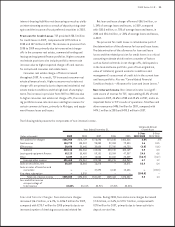
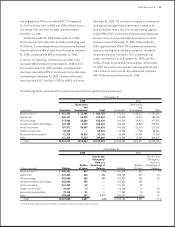
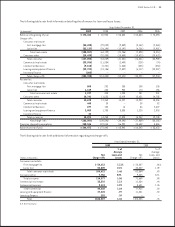
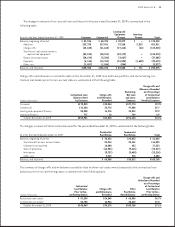
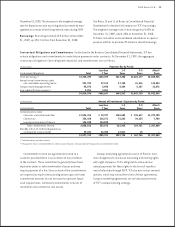
The following tables summarize TCF’s commercial real estate loan portfolio by property type.
At December 31,
2008
Construction
and
(In thousands) Permanent Development Total
Retail services (1) $ 792,312 $ 49,117 $ 841,429
Apartments 572,545 13,210 585,755
Ofce buildings 443,509 34,413 477,922
Warehouse/industrial buildings 405,284 18,583 423,867
Hotels and motels 148,502 62,714 211,216
Health care facilities 24,390 1,926 26,316
Residential home builders 36,495 40,959 77,454
Other 270,048 70,149 340,197
Total $2,693,085 $291,071 $2,984,156
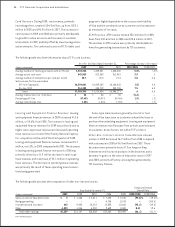
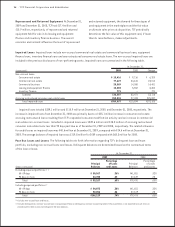
At December 31,
2008
Over 30-Day
Delinquency
Rate as a
Number Percentage of
(Dollars in thousands) Balance of Loans Balance
Retail services (1) $ 841,429 532 —%
Apartments 585,755 597 .04
Ofce buildings 477,922 260 .53
Warehouse/industrial buildings 423,867 282 —
Hotels and motels 211,216 49 —
Health care facilities 26,316 12 .50
Residential home builders 77,454 75 .43
Other 340,197 223 .02
Total $2,984,156 2,030 .11%
(1) Primarily retail shopping centers and stores, convenience stores, gas stations and restaurants.