TCF Bank 2009 Annual Report Download - page 44
Download and view the complete annual report
Please find page 44 of the 2009 TCF Bank annual report below. You can navigate through the pages in the report by either clicking on the pages listed below, or by using the keyword search tool below to find specific information within the annual report.-
 1
1 -
2
-
3
-
4
-
5
-
6
-
7
-
8
-
9
-
10
-
11
-
12
-
13
-
14
-
15
-
16
-
17
-
18
-
19
-
20
-
21
-
22
-
23
-
24
-
25
-
26
-
27
-
28
-
29
-
30
-
31
-
32
-
33
-
 34
34 -
 35
35 -
 36
36 -
 37
37 -
 38
38 -
 39
39 -
 40
40 -
 41
41 -
 42
42 -
 43
43 -
 44
44 -
 45
45 -
 46
46 -
 47
47 -
 48
48 -
 49
49 -
 50
50 -
 51
51 -
 52
52 -
 53
53 -
 54
54 -
55
-
56
-
57
-
58
-
59
-
60
-
61
-
62
-
63
-
64
-
65
-
66
-
67
-
68
-
69
-
70
-
71
-
72
-
73
-
74
-
75
-
76
-
77
-
78
-
79
-
80
-
81
-
82
-
83
-
84
-
85
-
86
-
87
-
88
-
89
-
90
-
91
-
92
-
93
-
94
-
95
-
96
-
97
-
98
-
99
-
100
-
101
-
102
-
103
-
104
-
105
-
106
-
107
-
108
-
109
-
110
-
111
-
112
-
113
-
114
 |
 |

28 : TCF Financial Corporation and Subsidiaries
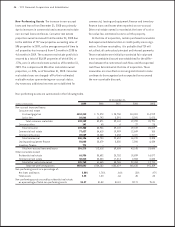
Retail Lending TCF’s consumer real estate loan portfolio
represents approximately half of its total loan and lease
portfolio. The consumer real estate portfolio was at in
2009 and increased 3.6% in 2008.
TCF’s consumer real estate portfolio is secured by
mortgages led on residential real estate. At December 31,
2009, 68% of loan balances were secured by rst mortgages.
The average loan size secured by a rst mortgage was
$117 thousand and the average balance of loans secured by
a junior lien position was $36 thousand at December 31, 2009.
At December 31, 2009, 27% of the consumer real estate port-
folio carried a variable interest rate tied to the prime rate,
compared with 25% at December 31, 2008. At January 1, 2010,
$1.7 billion or 91% of variable-rate consumer real estate
loans were at their contractual interest rate oor, compared
with $1.8 billion or 98% at January 1, 2009.
At December 31, 2009, 76% of TCF’s consumer real estate
loans consisted of closed-end loans, compared with 77%
at December 31, 2008. TCF’s closed-end consumer real
estate loans require payments of principal and interest
over a xed term. The average home value, which is based
on original values securing the loans and lines of credit in
this portfolio, was $250 thousand as of December 31, 2009.
TCF’s consumer real estate lines of credit require regular
payments of interest and do not require regular payments
of principal. The average FICO (Fair Isaac Company) credit
score at loan origination for the consumer real estate
portfolio was 725 as of December 31, 2009 and 723 as of
December 31, 2008.
TCF’s consumer real estate underwriting standards are
intended to produce adequately secured loans to customers
with good credit scores at the origination date. Loans with
loan-to-value (LTV) ratios in excess of 90% are only made
to creditworthy customers based on risk scoring models
and other credit underwriting criteria. TCF does not have
any subprime lending programs and does not originate 2/28
adjustable-rate mortgages (ARM) or Option ARM loans.
TCF also does not originate consumer real estate loans with
multiple payment options or loans with “teaser” interest
rates. Although TCF does not have any programs that target
subprime borrowers, in the normal course of lending to
customers, loans have been originated with FICO scores
below 620 at lower LTV ratios. Approximately 6% of the
consumer real estate portfolio, as of December 31, 2009,
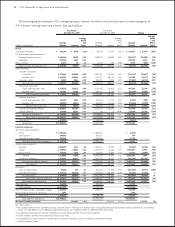
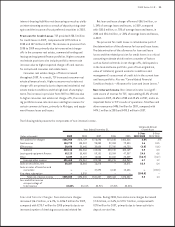
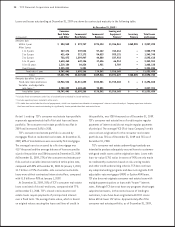
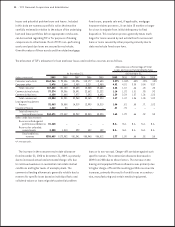
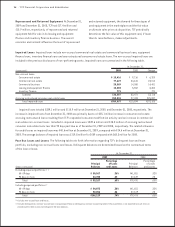
Loans and leases outstanding at December 31, 2009 are shown by contractual maturity in the following table.
(3)
(In thousands) (2)
Amounts due:
Within 1 year
After 1 year:
1 to 2 years
2 to 3 years
3 to 5 years
5 to 10 years
10 to 15 years
Over 15 years
Total after 1 year
Total
Amounts due after 1 year on:
Fixed-rate loans and leases
Variable- and adjustable-
rate loans (1)
Total after 1 year
(1) Excludes xed-term amounts under lines of credit which are included in closed-end loans.
(2) Excludes operating leases included in other assets.
(3) This table does not include the effect of prepayments, which is an important consideration in management’s interest-rate risk analysis. Company experience indicates
that loans and leases remain outstanding for signicantly shorter periods than their contractual terms.