Suzuki 2013 Annual Report Download - page 61
Download and view the complete annual report
Please find page 61 of the 2013 Suzuki annual report below. You can navigate through the pages in the report by either clicking on the pages listed below, or by using the keyword search tool below to find specific information within the annual report.-
 1
1 -
2
-
3
-
4
-
5
-
6
-
7
-
8
-
9
-
10
-
11
-
12
-
13
-
14
-
15
-
16
-
17
-
18
-
19
-
20
-
21
-
22
-
23
-
24
-
25
-
26
-
27
-
28
-
29
-
30
-
31
-
32
-
33
-
34
-
35
-
36
-
37
-
38
-
39
-
40
-
41
-
42
-
43
-
44
-
45
-
46
-
47
-
48
-
49
-
50
-
 51
51 -
 52
52 -
 53
53 -
 54
54 -
 55
55 -
 56
56 -
 57
57 -
 58
58 -
 59
59 -
 60
60 -
 61
61 -
 62
62 -
 63
63 -
 64
64
 |
 |

Consolidated Financial Statements
SUZUKI MOTOR CORPORATION 59
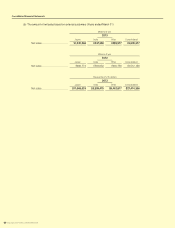
(Reference information)
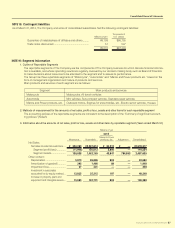
As reference information, operating results by geographical areas were as follows
(a) The amount of net sales, operating income or loss based on location of
The Company and its consolidated subsidiaries (Years ended March 31)
American Suzuki Motor Corporation, a former subsidiary of Suzuki Motor Corporation which distributed automobiles, motor-
cycles, ATVs, marine products and related parts/accessories in the United States (excluding Hawaii), discontinued distribu-
tion of automobiles in this scal year. As a result, The Group reviewed classication of geographical areas and changed it
from previous ve areas, namely “Japan”, “Europe”, “North America”, “Asia” and “Other areas” to four areas, namely “Japan”,
“Europe”, “Asia” and “Other areas”. Operating results by geographical areas in previous scal year were prepared by us-
ing new classication.
* American Suzuki Motor Corporation was liquidated in March 2013
Millions of yen
2013
Japan Europe Asia
Other
areas Eliminations Consolidated
Net Sales:
Net sales to external customers ...
¥1,203,474
¥ 254,692 ¥ 951,713 ¥ 168,437 ¥ —
¥2,578,317
Internal net sales or transfer
among geographical areas ..........
348,576
3,594 29,298 660 (382,129)
—
Total
1,552,050
258,287 981,012 169,097 (382,129)
2,578,317
Operating income (loss) ...................
102,516 (1,062
)
38,071 3,052 1,986 144,564
Millions of yen
2012
Japan Europe Asia
Other
areas Eliminations Consolidated
Net Sales:
Net sales to external customers ...
¥1,185,782
¥ 304,650 ¥ 844,878 ¥ 176,874 ¥ —
¥2,512,186
Internal net sales or transfer
among geographical areas ..........
360,362
2,035 24,320 480 (387,198)
—
Total
1,546,145
306,686 869,198 177,354 (387,198)
2,512,186
Operating income .............................
79,575 2,213 31,596 2,563 3,354 119,304
Thousands of U.S. dollars
2013
Japan Europe Asia
Other
areas Eliminations Consolidated
Net sales:
Net sales to external customers ...
$12,796,112
$2,708,057
$10,119,224
$1,790,930 $ —
$27,414,326
Internal net sales or transfer
among geographical areas ..........
3,706,285
38,220
311,525
7,020 (4,063,050) —
Total
16,502,398
2,746,277
10,430,749
1,797,951 (4,063,050)
27,414,326
Operating income .............................
1,090,020
(11,294)
404,799
32,453 21,118
1,537,098
* “Other areas” consists principally of North America, Oceania and South America.