Suzuki 2013 Annual Report Download - page 29
Download and view the complete annual report
Please find page 29 of the 2013 Suzuki annual report below. You can navigate through the pages in the report by either clicking on the pages listed below, or by using the keyword search tool below to find specific information within the annual report.-
 1
1 -
2
-
3
-
4
-
5
-
6
-
7
-
8
-
9
-
10
-
11
-
12
-
13
-
14
-
15
-
16
-
17
-
18
-
 19
19 -
 20
20 -
 21
21 -
 22
22 -
 23
23 -
 24
24 -
 25
25 -
 26
26 -
 27
27 -
 28
28 -
 29
29 -
 30
30 -
 31
31 -
 32
32 -
 33
33 -
 34
34 -
 35
35 -
 36
36 -
 37
37 -
 38
38 -
 39
39 -
40
-
41
-
42
-
43
-
44
-
45
-
46
-
47
-
48
-
49
-
50
-
51
-
52
-
53
-
54
-
55
-
56
-
57
-
58
-
59
-
60
-
61
-
62
-
63
-
64
 |
 |

SUZUKI MOTOR CORPORATION 27
SUZUKI MOTOR CORPORATION 27
Financial review
1. Operating results
(1) The operating results by segment
(a) Motorcycle
The net sales decreased by ¥24.5 billion (9.6%) to ¥230.3 billion year-on-year, mainly due to the sales decrease in
Europe and Asia. As for the operating income, the operating loss of ¥2.4 billion in the previous scal year became an
operating loss of ¥11.9 billion.
(b) Automobile
The Japanese domestic net sales increased year-on-year as a result of expanding its sales and strengthening the products
such as by the launch of the new WagonR and Spacia. As for the overseas, the net sales increased year-on-year by covering
the sales decrease in Europe and the impact of the exchange conversion due to the yen appreciation, with the sales increase
in Asia. As a result, the overall net sales of the automobile business increased by ¥88.8 billion (4.0%) to ¥2,297.8 billion year-
on-year. Operating income increased by ¥36.1 billion (31.5%) to ¥150.6 billion year-on-year, mainly due to the increase of
income in India, Indonesia, and the Japanese domestic automobile business.
(c) Marine and Power products, etc
The net sales increased by ¥1.8 billion (3.6%) to ¥50.2 billion year-on-year. Operating income decreased by ¥1.3 billion (17.7%)
to ¥5.9 billion year-on-year.
(2) The operating results by geographical areas
(a) Japan
Despite decrease of export to Europe and other areas, the net sales increased by ¥5.9 billion (0.4%) to ¥1,552.1 billion year-
on-year due to increased sales of automobiles in Japanese domestic market. The operating income also increased by ¥22.9
billion (28.8%) to ¥102.5 billion year-on-year. The Group was able to increase the operating income by covering the factors of
income decrease of exports such as impact of the exchange rate with the factors of income increase such as the increased
sales of automobiles in Japanese domestic market and cost reduction.
(b) Europe
Due to the economic stagnation in Europe, the net sales decreased by ¥48.4 billion (15.8%) to ¥258.3 billion year-on-year. Op-
erating income of ¥2.2 billion in the previous scal year became an operating loss of ¥1.1 billion.
(c) Asia
The net sales increased by ¥111.8 billion (12.9%) to ¥981.0 billion year-on-year mainly due to increased sales of automobiles
in India, Indonesia and Thailand. The operating income increased by ¥6.5 billion (20.5%) to ¥38.1 billion year-on-year.
(e) Other areas
Sales decreased by ¥8.3 billion (4.7%) to ¥169.1 billion year-on-year. Operating income increased by ¥0.5 billion (19.1%) to
¥3.1 billion year-on-year.
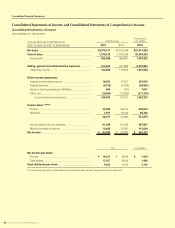
(3)Selling,generalandadministrativeexpenses
In the current consolidated scal year, the amount of selling, general and administrative expenses increased by ¥36.9 billion (7.7%)
to ¥514.5 billion year-on-year because of increase of advertising expenses and research & development expenses.
(4)Otherincomeandexpenses
In the current consolidated scal year, the net amount of other income and expenses was a loss of ¥5.2 billion, which increased
¥2.6 billion year-on-year. This was mainly due to loss on liquidation of subsidiaries and afliates despite prot from nancial activi-
ties and others.