Suzuki 2013 Annual Report Download - page 39
Download and view the complete annual report
Please find page 39 of the 2013 Suzuki annual report below. You can navigate through the pages in the report by either clicking on the pages listed below, or by using the keyword search tool below to find specific information within the annual report.-
 1
1 -
2
-
3
-
4
-
5
-
6
-
7
-
8
-
9
-
10
-
11
-
12
-
13
-
14
-
15
-
16
-
17
-
18
-
19
-
20
-
21
-
22
-
23
-
24
-
25
-
26
-
27
-
28
-
 29
29 -
 30
30 -
 31
31 -
 32
32 -
 33
33 -
 34
34 -
 35
35 -
 36
36 -
 37
37 -
 38
38 -
 39
39 -
 40
40 -
 41
41 -
 42
42 -
 43
43 -
 44
44 -
 45
45 -
 46
46 -
 47
47 -
 48
48 -
 49
49 -
50
-
51
-
52
-
53
-
54
-
55
-
56
-
57
-
58
-
59
-
60
-
61
-
62
-
63
-
64
 |
 |

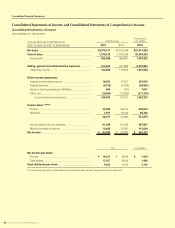
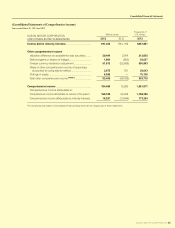
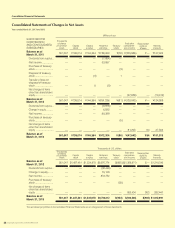
Consolidated Financial Statements
SUZUKI MOTOR CORPORATION 37
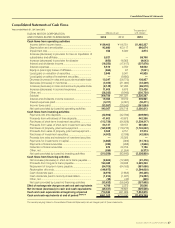
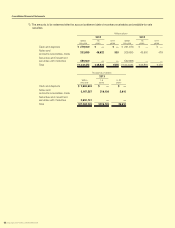
Consolidated Statements of Cash Flows
Years ended March 31, 2013 and 2012
SUZUKI MOTOR CORPORATION
AND CONSOLIDATED SUBSIDIARIES
Millions of yen
Thousands of
U.S. dollars
2013 2012 2013
Cashowsfromoperatingactivities
Income before income taxes ............................................. ¥139,403 ¥116,751 $1,482,227
Depreciation and amortization .......................................... 93,680 103,117 996,074
Impairment loss ................................................................. 458 6,030 4,874
Increase (decrease) in provision for loss on liquidation of
subsidiaries and afliates .................................................. 5,521 —58,708
Increase (decrease) in provision for disaster (850)18,065 (9,043)
Interest and dividends income .......................................... (19,550)(17,617)(207,876)
Interest expenses .............................................................. 5,510 4,750 58,592
Equity in (earnings) losses of afliates .............................. (664)67 (7,061)
Loss (gain) on valuation of securities ............................... 3,849 5,341 40,925
Loss (gain) on sales of investment securities ................... —(9,650)—
Decrease (increase) in notes and accounts receivable-trade
10,247 (58,773)108,957
Decrease (increase) in inventories ................................... (3,029)(21,060)(32,209)
Increase (decrease) in notes and accounts payable-trade
(8,142)97,280 (86,579)
Increase (decrease) in accrued expenses ...................... 11,608 6,676 123,428
Other, net ............................................................................ (28,282)(9,945)(300,720)
Subtotal 209,759 241,031 2,230,297
Interest and dividends income received .......................... 19,466 19,312 206,981
Interest expenses paid ...................................................... (5,211)(4,081)(55,411)
Income taxes paid ............................................................. (33,957)(29,543)(361,054)
Net cash provided by (used in) operating activities 190,057 226,718 2,020,813
Cashowsfrominvestingactivities
Payments into time deposits ............................................. (32,908)(42,786)(349,906)
Proceeds from withdrawal of time deposits...................... 41,603 40,875 442,356
Purchases of short-term investment securities ................ (113,726)(84,628)(1,209,217)
Proceeds from sales of short-term investment securities
64,127 59,157 681,843
Purchases of property, plant and equipment ................... (163,929)(119,210)(1,743,002)
Proceeds from sales of property, plant and equipment ... 3,505 3,751 37,274
Purchases of investment securities .................................. (4,002)(2,188)(42,559)
Proceeds from sales and redemption of investment securities
. —25,025 —
Payments for investments in capital ................................. (4,865)(384)(51,734)
Payments of loans receivable ........................................... (436)(458)(4,636)
Collection of loans receivable ........................................... 673 28,759 7,156
Other, net ............................................................................ (599)(1,554)(6,373)
Net cash provided by (used in) investing activities (210,559)(93,643)(2,238,800)
Cashowsfromnancingactivities
Net increase (decrease) in short-term loans payable ...... (8,603)(12,480)(91,476)
Proceeds from long-term loans payable .......................... 190,482 29,948 2,025,330
Repayment of long-term loans payable ........................... (54,708)(64,165)(581,696)
Redemption of bonds ........................................................ (149,975)—(1,594,630)
Cash dividends paid ......................................................... (8,975)(7,853)(95,435)
Cash dividends paid to minority shareholders ................. (1,814)(1,947)(19,292)
Other, net ............................................................................ (38)(42)(405)
Net cash provided by (used in) nancing activities (33,632)(56,540)(357,605)
Effectofexchangeratechangesoncashandcashequivalents
4,706 2,072 50,046
Netincrease(decrease)incashandcashequivalents (49,427)78,607 (525,546)
Cashandcashequivalentsatbeginningofperiod 710,530 631,923 7,554,815
Cashandcashequivalentsatendofperiod *NOTE 10 ¥661,102 ¥710,530 $7,029,269
The accompanying Notes to Consolidated Financial Statements are an integral part of these statements.