Suzuki 2013 Annual Report Download - page 55
Download and view the complete annual report
Please find page 55 of the 2013 Suzuki annual report below. You can navigate through the pages in the report by either clicking on the pages listed below, or by using the keyword search tool below to find specific information within the annual report.-
 1
1 -
2
-
3
-
4
-
5
-
6
-
7
-
8
-
9
-
10
-
11
-
12
-
13
-
14
-
15
-
16
-
17
-
18
-
19
-
20
-
21
-
22
-
23
-
24
-
25
-
26
-
27
-
28
-
29
-
30
-
31
-
32
-
33
-
34
-
35
-
36
-
37
-
38
-
39
-
40
-
41
-
42
-
43
-
44
-
 45
45 -
 46
46 -
 47
47 -
 48
48 -
 49
49 -
 50
50 -
 51
51 -
 52
52 -
 53
53 -
 54
54 -
 55
55 -
 56
56 -
 57
57 -
 58
58 -
 59
59 -
 60
60 -
 61
61 -
 62
62 -
 63
63 -
 64
64
 |
 |

Consolidated Financial Statements
SUZUKI MOTOR CORPORATION 53
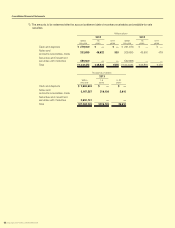
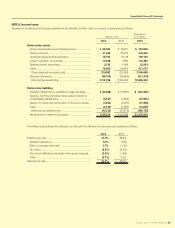
NOTE 8:Incometaxes
Breakdown of deferred tax assets and deferred tax liabilities by their main occurrence causes were as follows.
Millions of yen
Thousands of
U.S. dollars
2013 2012 2013
Deferredtaxassets
Excess-depreciation and Impairment loss ....................... ¥ 68,083 ¥ 78,671 $ 723,908
Various reserves ................................................................. 41,433 45,274 440,545
Unrealized gross prots elimination .................................. 18,725 16,719 199,105
Loss on valuation of securities .......................................... 12,648 7,985 134,492
Deferred assets and others ............................................... 3,154 1,668 33,544
Other ................................................................................... 76,845 69,973 817,073
Gross deferred tax assets total ....................................... 220,892 220,293 2,348,668
Valuation allowance ........................................................... (48,183)(35,650)(512,319)
Deferred tax assets total ................................................. ¥172,708 ¥184,642 $1,836,349
Deferredtaxliabilities
Valuation difference on available-for-sale securities ........ ¥ (30,468)¥ (15,957)$ (323,956)
Variance from the complete market value method of
consolidated subsidiaries ................................................. (5,167)(4,952)(54,945)
Reserve for advanced depreciation of noncurrent assets
... (3,555)(3,437)(37,808)
Other ................................................................................... (4,140)(1,225)(44,025)
Deferred tax liabilities total .............................................. (43,332)(25,572)(460,735)
Net amounts of deferred tax assets .................................. ¥129,376 ¥159,069 $1,375,614
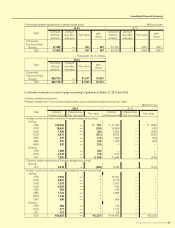
The differences between the statutory tax rate and the effective tax rate were summarized as follows.
2013 2012
Statutory tax rate .................................................................... 37.2% 39.8%
Valuation allowance ........................................................... 9.0% 0.9%
Effect of change of tax rate ............................................... 2.7% 11.4%
Tax credit ............................................................................ (5.9%) (5.5%)
Permanent difference (exclusion from gross revenue) .... (2.6%) (1.8%)
Other ................................................................................... (5.7%) 0.3%
Effective tax rate .................................................................... 34.7% 45.0%