Suzuki 2013 Annual Report Download - page 30
Download and view the complete annual report
Please find page 30 of the 2013 Suzuki annual report below. You can navigate through the pages in the report by either clicking on the pages listed below, or by using the keyword search tool below to find specific information within the annual report.-
 1
1 -
2
-
3
-
4
-
5
-
6
-
7
-
8
-
9
-
10
-
11
-
12
-
13
-
14
-
15
-
16
-
17
-
18
-
19
-
 20
20 -
 21
21 -
 22
22 -
 23
23 -
 24
24 -
 25
25 -
 26
26 -
 27
27 -
 28
28 -
 29
29 -
 30
30 -
 31
31 -
 32
32 -
 33
33 -
 34
34 -
 35
35 -
 36
36 -
 37
37 -
 38
38 -
 39
39 -
 40
40 -
41
-
42
-
43
-
44
-
45
-
46
-
47
-
48
-
49
-
50
-
51
-
52
-
53
-
54
-
55
-
56
-
57
-
58
-
59
-
60
-
61
-
62
-
63
-
64
 |
 |

28 SUZUKI MOTOR CORPORATION
Financial review
(5)Forecastsforthenextscalyear
As for the next scal year, while the exchange environment is improving and the sales in the growing markets such as India and
ASEAN are increasing, increase of depreciation and research and development expenses due to increased investments to sup-
port those growths would be expected. But The Group will work as one to reform in every eld to accomplish more than the below
forecasts for the consolidated operation by developing the business activity.
(Forecasts for the consolidated operating results-First Half)
Net sales ¥1,300.0 billion (up 6.0% year-on-year)
Operating income ¥82.5 billion (up 24.7% year-on-year)
Net income ¥50.0 billion (up 19.3% year-on-year)
Foreign exchange rates 97 yen/US$, 128yen/Euro, 1.71yen/Indian Rupee
0.99yen/100Indonesian Rupiah, 3.21yen/Thai Baht
(Forecasts for the consolidated operating results-Full Year)
Net sales ¥2,800.0 billion (up 8.6% year-on-year)
Operating income ¥165.0 billion (up 14.1% year-on-year)
Net income ¥100.0 billion (up 24.4% year-on-year)
Foreign exchange rates 96 yen/US$, 126yen/Euro, 1.65yen/Indian Rupee
0.97yen/100Indonesian Rupiah, 3.10yen/Thai Baht
(Anounced on August 1, 2013)
* The forecasts for the next scal year mentioned above are based on currently available information and assumptions,
contain risks and uncertainty and do not constitute guarantees of future achievement. Please note that the actual results
may greatly vary by the changes of various factors. Those factors, which may inuence the actual results, include economic
conditions and the trend of demand in major markets and the uctuations of foreign exchange rate (mainly US dollar/Yen
rate, Euro/Yen rate, Indian Rupee/Yen rate).
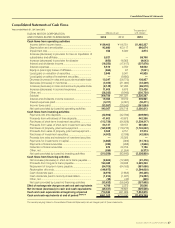
2. Liquidityandcapitalresources
(1)Cashow
Cash ow provided by operating activities for FY2012 amounted to ¥190.1 billion (¥226.7 billion was provided in the previous s-
cal year), and ¥210.6 billion was used for the acquisition of property, plant and equipment etc. in the investment activities (¥93.6
billion was used in the previous scal year). As a result, free cash ow amounted to ¥20.5 billion of negative (¥133.1 billion of posi-
tive for the previous scal year). In nancing activities, ¥33.6 billion was used in redemption of bonds with subscription rights to
shares which amounted ¥150.0 billion and others (¥56.5 billion was used in the previous scal year).
As a result, the balance of cash and cash equivalents at the end of FY2012 amounted ¥661.1 billion and decreased by ¥49.4 bil-
lion from the end of previous scal year.
(2)Demandformoney
During the current consolidated scal year, The Company and consolidated subsidiaries invested a total ¥169.3 billion of capital
expenditures on various areas such as development of new model and research & development.
Capital expenditure project for the next scal year is ¥270.0 billion. The required fund will be covered mainly by our own funds.
3. Signicantaccountingpolicies
For information regarding signicant accounting policies, please refer to the Notes to Consolidated Financial Statements.
* An amount less than 100 million yen has been rounded off in “nancial review” section.