Suzuki 2013 Annual Report Download - page 44
Download and view the complete annual report
Please find page 44 of the 2013 Suzuki annual report below. You can navigate through the pages in the report by either clicking on the pages listed below, or by using the keyword search tool below to find specific information within the annual report.-
 1
1 -
2
-
3
-
4
-
5
-
6
-
7
-
8
-
9
-
10
-
11
-
12
-
13
-
14
-
15
-
16
-
17
-
18
-
19
-
20
-
21
-
22
-
23
-
24
-
25
-
26
-
27
-
28
-
29
-
30
-
31
-
32
-
33
-
 34
34 -
 35
35 -
 36
36 -
 37
37 -
 38
38 -
 39
39 -
 40
40 -
 41
41 -
 42
42 -
 43
43 -
 44
44 -
 45
45 -
 46
46 -
 47
47 -
 48
48 -
 49
49 -
 50
50 -
 51
51 -
 52
52 -
 53
53 -
 54
54 -
55
-
56
-
57
-
58
-
59
-
60
-
61
-
62
-
63
-
64
 |
 |

42 SUZUKI MOTOR CORPORATION
Consolidated Financial Statements
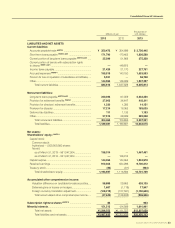
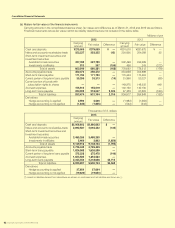
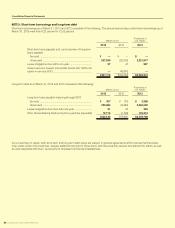
(b) Mattersforfairvaluesofthenancialinstruments
Carrying amounts in the consolidated balance sheet, fair values and difference as of March 31, 2013 and 2012 are as follows.
Financial instruments whose fair value cannot be reliably determined are not included in the below table.
Millions of yen
2013 2012
Carrying
amount Fair value Difference Carrying
amount Fair value Difference
Cash and deposits ¥279,009 ¥279,009 ¥ — ¥291,670 ¥291,670 ¥ —
Notes and accounts receivables-trade 253,237 253,225 (12) 254,066 254,099 32
Short-term investment securities and
Investment securities
Available-for-sale securities
Investments in afliates
327,789
513 327,789
357 —
(155)232,499
456
232,499
243
—
(212)
Total of assets 860,549 860,381 (168)778,692 778,512 (179)
Accounts payable-trade 350,472 350,472 —354,899 354,899 —
Short-term loans payable 171,790 171,790 —170,463 170,463 —
Current portion of long-term loans payable
35,299 35,313 (14)51,968 52,027 (58)
Current portion of bonds with
subscription rights to shares ———149,975 149,525 449
Accrued expenses
155,519 155,519 —140,150 140,150 —
Long-term loans payable 220,392 218,067 2,324 67,359 67,883 (523)
Total of liabilities 933,474 931,164 2,310 934,817 934,949 (132)
Derivatives
Hedge accounting is applied
Hedge accounting is not applied
2,596
(1,845)2,596
(1,845)—
—(1,983
(533
)
)
(1,983
(533
)
)
—
—
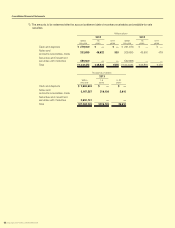
Thousands of U.S. dollars
2013
Carrying
amount Fair value Difference
Cash and deposits $2,966,603 $2,966,603 $ —
Notes and accounts receivables-trade 2,692,587 2,692,452 (135)
Short-term investment securities and
Investment securities
Available-for-sale securities
Investments in afliates
3,485,265
5,460 3,485,265
3,803 —
(1,656)
Total of assets 9,149,916 9,148,124 (1,792)
Accounts payable-trade 3,726,445 3,726,445 —
Short-term loans payable 1,826,588 1,826,588 —
Current portion of long-term loans payable
375,328 375,478 (149)
Accrued expenses
1,653,583 1,653,583 —
Long-term loans payable 2,343,350 2,318,638 24,712
Total of liabilities 9,925,297 9,900,734 24,562
Derivatives
Hedge accounting is applied
Hedge accounting is not applied
27,604
(19,620)27,604
(19,620)—
—
(*): Assets or liabilities derived from derivatives are shown on a net basis and net liabilities are shown as ( ).