Suzuki 2013 Annual Report Download - page 6
Download and view the complete annual report
Please find page 6 of the 2013 Suzuki annual report below. You can navigate through the pages in the report by either clicking on the pages listed below, or by using the keyword search tool below to find specific information within the annual report.-
 1
1 -
 2
2 -
 3
3 -
 4
4 -
 5
5 -
 6
6 -
 7
7 -
 8
8 -
 9
9 -
 10
10 -
 11
11 -
 12
12 -
 13
13 -
 14
14 -
 15
15 -
 16
16 -
 17
17 -
18
-
19
-
20
-
21
-
22
-
23
-
24
-
25
-
26
-
27
-
28
-
29
-
30
-
31
-
32
-
33
-
34
-
35
-
36
-
37
-
38
-
39
-
40
-
41
-
42
-
43
-
44
-
45
-
46
-
47
-
48
-
49
-
50
-
51
-
52
-
53
-
54
-
55
-
56
-
57
-
58
-
59
-
60
-
61
-
62
-
63
-
64
 |
 |
4 SUZUKI MOTOR CORPORATION
Financial Highlights
Financial Highlights
SUZUKI MOTOR CORPORATION
AND CONSOLIDATED SUBSIDIARIES
Years ended March 31, 2013 and 2012
Millions of yen
(except per share amounts)
Thousands of US
dollars (except per
share amounts)
2013 2012 2013
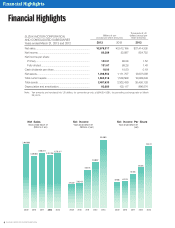
Net sales ................................................................................ ¥2,578,317 ¥2,512,186 $27,414,326
Net income............................................................................. 80,389 53,887 854,752
Net income per share:
Primary ............................................................................... 143.31 96.06 1.52
Fully diluted ........................................................................ 131.67 88.28 1.40
Cash dividends per share ..................................................... 18.00 15.00 0.19
Net assets .............................................................................. 1,298,553 1,111,757 13,807,058
Total current assets ................................................................ 1,560,218 1,509,568 16,589,249
Total assets ............................................................................ 2,487,635 2,302,439 26,450,133
Depreciation and amortization .............................................. 93,680 103,117 996,074
Note: Yen amounts are translated into US dollars, for convenience only, at ¥94.05=US$1, the prevailing exchange rate on March
29, 2013.
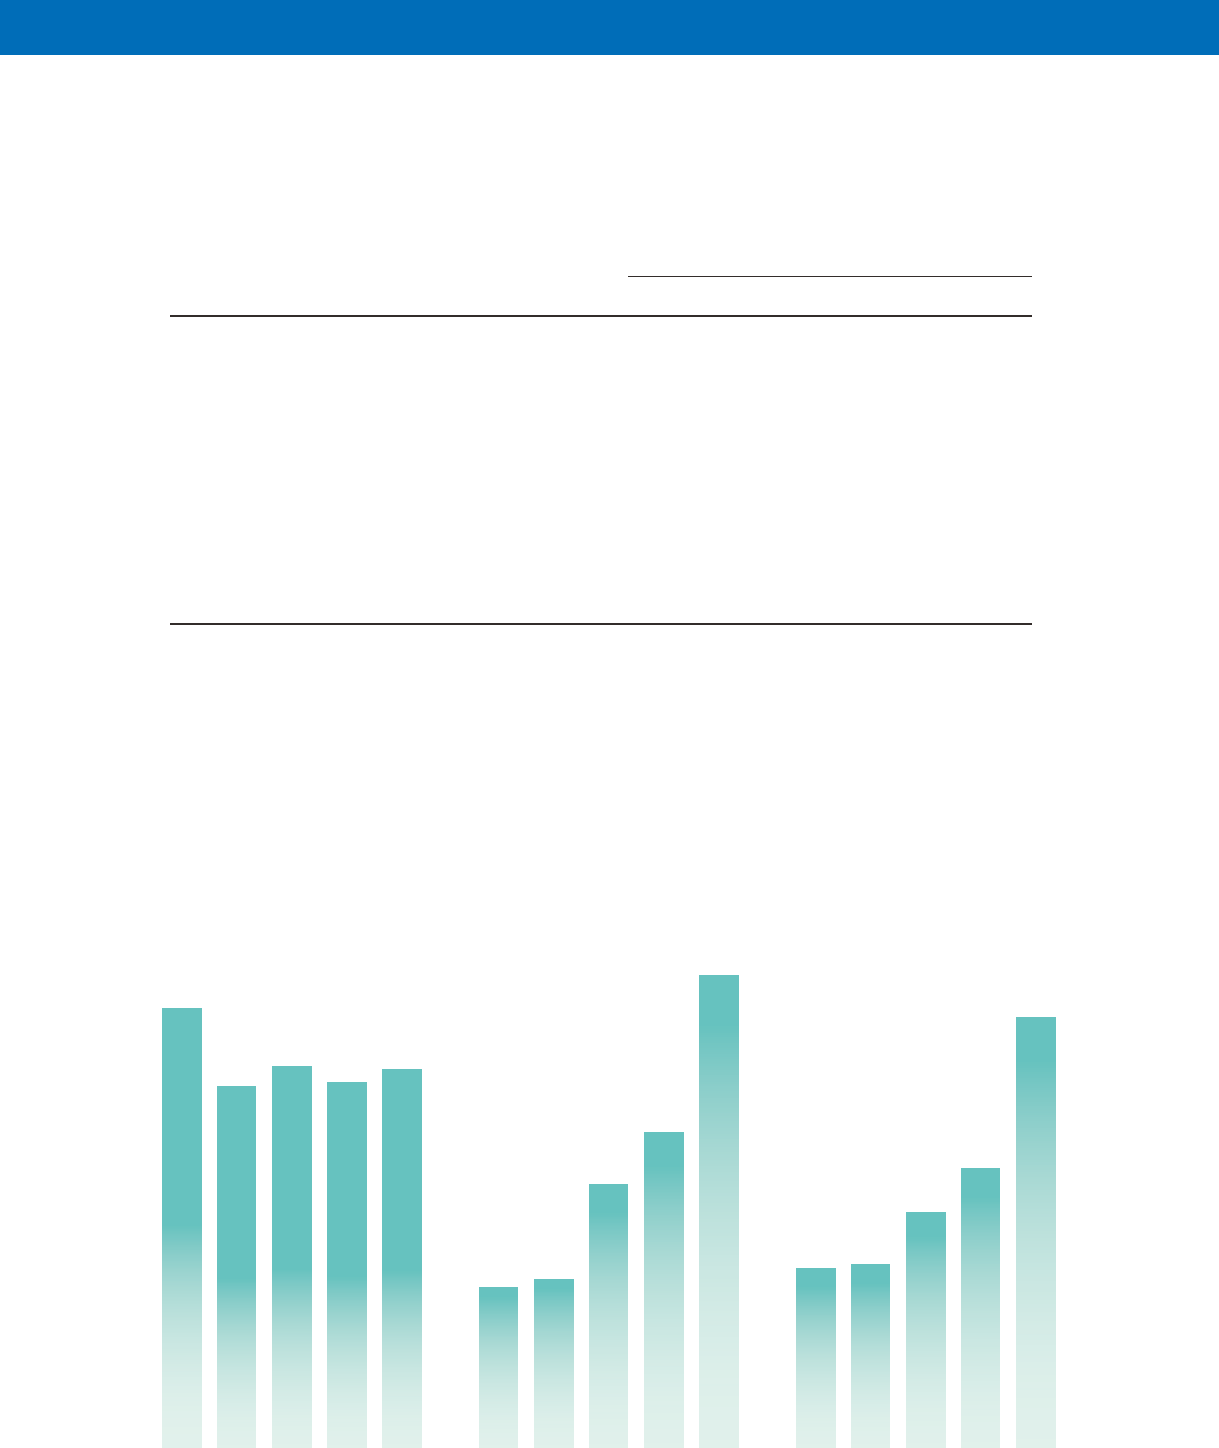
2,469,063
2,608,217
3,004,888
27,429 28,913
45,174
61.68 62.76
80.65
2,512,186
53,887
96.06
Years ended March 31
(Millions of yen)
Net Sales
Years ended March 31
(Millions of yen)
Net Income
Years ended March 31
(yen)
Net Income Per Share
2009 2010 2010 2011 2012 20102009 2009 2011 20122011 2012
2,578,317
2012 2013
80,389
2013
143.31
2013