Suzuki 2013 Annual Report Download - page 47
Download and view the complete annual report
Please find page 47 of the 2013 Suzuki annual report below. You can navigate through the pages in the report by either clicking on the pages listed below, or by using the keyword search tool below to find specific information within the annual report.-
 1
1 -
2
-
3
-
4
-
5
-
6
-
7
-
8
-
9
-
10
-
11
-
12
-
13
-
14
-
15
-
16
-
17
-
18
-
19
-
20
-
21
-
22
-
23
-
24
-
25
-
26
-
27
-
28
-
29
-
30
-
31
-
32
-
33
-
34
-
35
-
36
-
 37
37 -
 38
38 -
 39
39 -
 40
40 -
 41
41 -
 42
42 -
 43
43 -
 44
44 -
 45
45 -
 46
46 -
 47
47 -
 48
48 -
 49
49 -
 50
50 -
 51
51 -
 52
52 -
 53
53 -
 54
54 -
 55
55 -
 56
56 -
 57
57 -
58
-
59
-
60
-
61
-
62
-
63
-
64
 |
 |
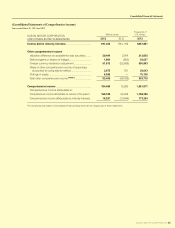
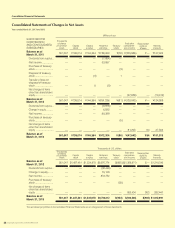
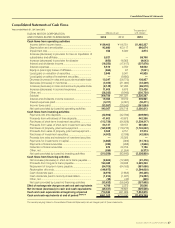
Consolidated Financial Statements
SUZUKI MOTOR CORPORATION 45
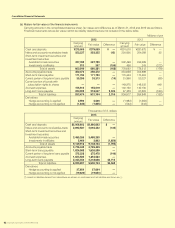
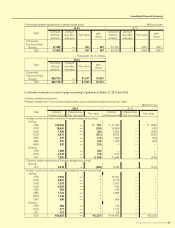
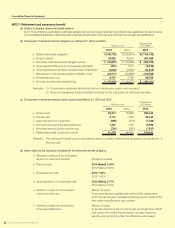
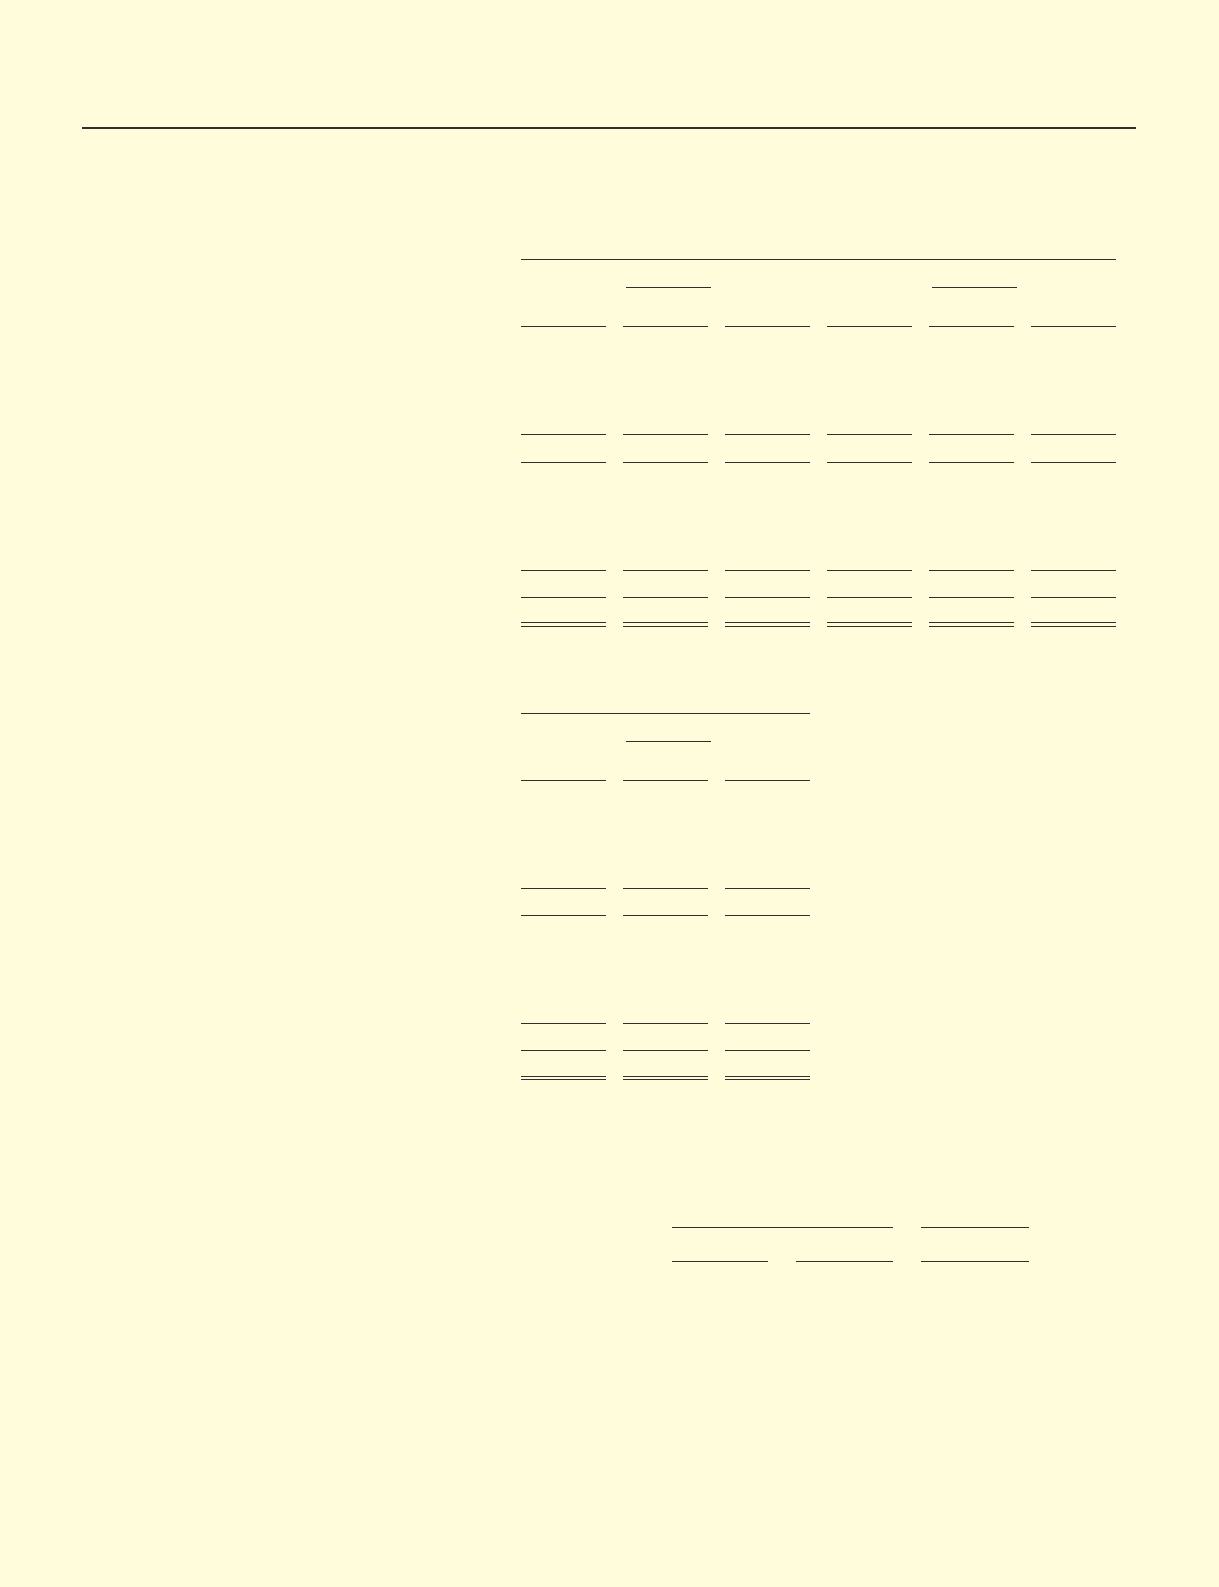
(c) Securities
a. Available-for-sale securities with market value as of March 31, 2013 and 2012
Millions of yen
2013 2012
Acquisition
cost
Carrying
Amount Difference
Acquisition
cost
Carrying
Amount Difference
Securities for which the carrying amount exceeds the acquisition costs
Stocks .................................................... ¥ 86,883 ¥176,008 ¥ 89,124 ¥ 72,961 ¥121,006 ¥ 48,044
Bonds .................................................... ———2,809 2,809 —
Other ...................................................... 144,648 147,424 2,776 90,892 92,038 1,145
Sub Total ¥231,531 ¥323,432 ¥ 91,901 ¥166,663 ¥215,853 ¥ 49,190
Securities for which the carrying amount does not exceed the acquisition costs
Stocks .................................................... ¥ 5,158 ¥ 4,356 ¥ (801)¥ 19,723 ¥ 16,645 ¥ (3,077)
Bonds .................................................... ——————
Other ...................................................... ——————
Sub Total ¥ 5,158 ¥ 4,356 ¥ (801)¥ 19,723 ¥ 16,645 ¥ (3,077)
Total ¥236,689 ¥327,789 ¥ 91,099 ¥186,387 ¥232,499 ¥ 46,112
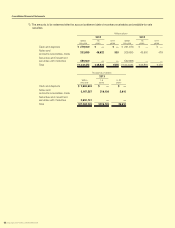
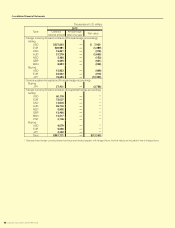
Thousands of U.S. dollars
2013
Acquisition
cost
Carrying
Amount Difference
Securities for which the carrying amount exceeds the acquisition costs
Stocks ....................................................
$ 923,800
$1,871,432
$947,632
Bonds .................................................... ———
Other ...................................................... 1,537,990 1,567,510 29,520
Sub Total
$2,461,790 $3,438,943
$977,152
Securities for which the carrying amount does not exceed the acquisition costs
Stocks .................................................... $ 54,847 $ 46,321 $ (8,525)
Bonds .................................................... ———
Other ...................................................... ———
Sub Total $ 54,847 $ 46,321 $ (8,525)
Total
$2,516,638 $3,485,265
$968,626
b. Available-for-sale securities sold during 2013 and 2012
Millions of yen
Thousands of
U.S. dollars
2013 2012 2013
Amounts sold ..................................................................... ¥64,127 ¥73,822 $681,843
Gains on sales of available-for-sale securities ................. —9,650 —
Loss on sales of available-for-sale securities .................. ———