Supercuts 2005 Annual Report Download - page 64
Download and view the complete annual report
Please find page 64 of the 2005 Supercuts annual report below. You can navigate through the pages in the report by either clicking on the pages listed below, or by using the keyword search tool below to find specific information within the annual report.-
 1
1 -
2
-
3
-
4
-
5
-
6
-
7
-
8
-
9
-
10
-
11
-
12
-
13
-
14
-
15
-
16
-
17
-
18
-
19
-
20
-
21
-
22
-
23
-
24
-
25
-
26
-
27
-
28
-
29
-
30
-
31
-
32
-
33
-
34
-
35
-
36
-
37
-
38
-
39
-
40
-
41
-
42
-
43
-
44
-
45
-
46
-
47
-
48
-
49
-
50
-
51
-
52
-
53
-
 54
54 -
 55
55 -
 56
56 -
 57
57 -
 58
58 -
 59
59 -
 60
60 -
 61
61 -
 62
62 -
 63
63 -
 64
64 -
 65
65 -
 66
66 -
 67
67 -
 68
68 -
 69
69 -
 70
70 -
 71
71 -
 72
72 -
 73
73 -
 74
74 -
75
-
76
-
77
-
78
-
79
-
80
-
81
-
82
-
83
-
84
-
85
-
86
-
87
-
88
-
89
-
90
-
91
-
92
-
93
-
94
-
95
-
96
-
97
-
98
-
99
-
100
-
101
-
102
-
103
-
104
-
105
-
106
-
107
-
108
-
109
-
110
-
111
-
112
-
113
-
114
-
115
-
116
-
117
-
118
-
119
-
120
-
121
 |
 |

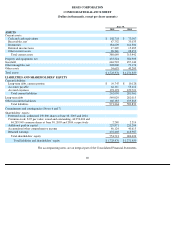
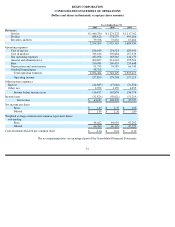
REGIS CORPORATION
CONSOLIDATED STATEMENT OF CASH FLOWS
(Dollars in thousands)
*
Changes in operating assets and liabilities do not include assets and liabilities assumed through acquisitions
The accompanying notes are an integral part of the Consolidated Financial Statements.
63
Years Ended June 30,
2005
2004
2003
Cash flows from operating activities:
Net income
$
64,631
$
104,218
$
85,555
Adjustments to reconcile net income to net cash provided by
operating activities:
Depreciation
83,527
72,096
63,767
Amortization
8,226
3,451
3,632
Deferred income taxes
(9,257
)
15,340
2,781
Goodwill impairment
38,319
—
—
Tax benefit from stock
-
based employee compensation plans
9,088
8,314
4,090
Other noncash items affecting earnings
1,181
1,265
710
Changes in operating assets and liabilities*:
Receivables
(6,516
)
(16
)
8
Inventories
(17,974
)
(462
)
(31,145
)
Other current assets
1,437
(10,629
)
2,120
Other assets
(5,726
)
(1,387
)
(13,606
)
Accounts payable
8,288
(13,305
)
(2,727
)
Accrued expenses
23,338
9,461
21,105
Other noncurrent liabilities
17,169
17,318
14,829
Net cash provided by operating activities
215,731
205,664
151,119
Cash flows from investing activities:
Capital expenditures
(101,097
)
(74,076
)
(77,460
)
Proceeds from sale of assets
846
432
1,273
Purchases of salon and school net assets, net of cash acquired
(118,915
)
(99,734
)
(66,880
)
Purchase of hair restoration centers, net of cash acquired
(209,652
)
—
—
Net cash used in investing activities
(428,818
)
(173,378
)
(143,067
)
Cash flows from financing activities:
Borrowings on revolving credit facilities
2,954,100
514,650
854,195
Payments on revolving credit facilities
(2,976,750
)
(508,025
)
(886,420
)
Proceeds from issuance of long
-
term debt
301,938
11,887
30,000
Repayments of long
-
term debt
(21,313
)
(24,111
)
(11,471
)
Other, primarily (decrease) increase in negative book cash balances
(2,472
)
118
(2,720
)
Dividends paid
(7,149
)
(6,166
)
(5,202
)
Repurchase of common stock
(23,117
)
(22,548
)
(21,694
)
Proceeds from issuance of common stock
17,257
17,347
7,051
Net cash provided by (used in) financing activities
242,494
(16,848
)
(36,261
)
Effect of exchange rate changes on cash and cash equivalents
(256
)
2,675
2,122
Increase (decrease) in cash and cash equivalents
29,151
18,113
(26,087
)
Cash and cash equivalents:
Beginning of year
73,567
55,454
81,541
End of year
$
102,718
$
73,567
$
55,454