Supercuts 2005 Annual Report Download - page 38
Download and view the complete annual report
Please find page 38 of the 2005 Supercuts annual report below. You can navigate through the pages in the report by either clicking on the pages listed below, or by using the keyword search tool below to find specific information within the annual report.-
 1
1 -
2
-
3
-
4
-
5
-
6
-
7
-
8
-
9
-
10
-
11
-
12
-
13
-
14
-
15
-
16
-
17
-
18
-
19
-
20
-
21
-
22
-
23
-
24
-
25
-
26
-
27
-
 28
28 -
 29
29 -
 30
30 -
 31
31 -
 32
32 -
 33
33 -
 34
34 -
 35
35 -
 36
36 -
 37
37 -
 38
38 -
 39
39 -
 40
40 -
 41
41 -
 42
42 -
 43
43 -
 44
44 -
 45
45 -
 46
46 -
 47
47 -
 48
48 -
49
-
50
-
51
-
52
-
53
-
54
-
55
-
56
-
57
-
58
-
59
-
60
-
61
-
62
-
63
-
64
-
65
-
66
-
67
-
68
-
69
-
70
-
71
-
72
-
73
-
74
-
75
-
76
-
77
-
78
-
79
-
80
-
81
-
82
-
83
-
84
-
85
-
86
-
87
-
88
-
89
-
90
-
91
-
92
-
93
-
94
-
95
-
96
-
97
-
98
-
99
-
100
-
101
-
102
-
103
-
104
-
105
-
106
-
107
-
108
-
109
-
110
-
111
-
112
-
113
-
114
-
115
-
116
-
117
-
118
-
119
-
120
-
121
 |
 |

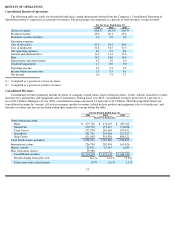
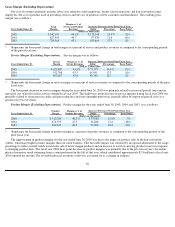
associated with inventory gross profit margins (and thus reduced the cost of product sales) and was driven primarily by our ability to negotiate
favorable terms with our suppliers due to our size and volume of purchases. We subsequently adjusted our cost of goods usage percentages
based on the results of this physical inventory.
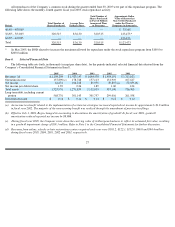
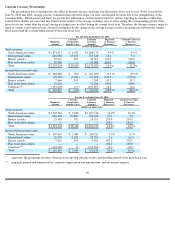
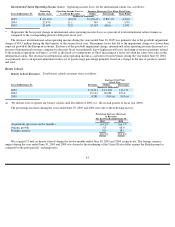
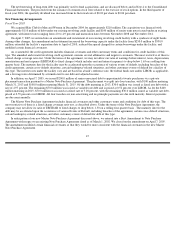
Site Operating Expenses
This expense category includes direct costs incurred by our salons, beauty schools and hair restoration centers, such as on-site advertising,
workers’ compensation, insurance, utilities and janitorial costs. Site operating expenses were as follows:
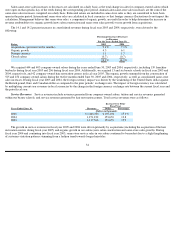
* Represents the basis point change in site operating expenses as a percent of total revenues as compared to the corresponding periods of
the prior fiscal year.
The basis point improvement in site operating expenses during the year ended June 30, 2005 was primarily due to the addition of the hair
restoration centers in December 2004, which have lower site operating expenses as a percentage of total revenue. During fiscal year 2004, site
operating expenses were relatively consistent as a percent of total revenues as compared to the prior fiscal year.
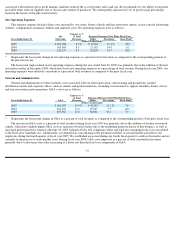
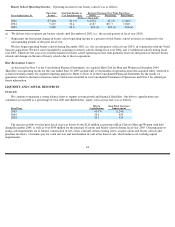
General and Administrative
General and administrative (G&A) includes costs associated with our field supervision, salon training and promotions, product
distribution centers and corporate offices (such as salaries and professional fees), including costs incurred to support franchise, beauty school
and hair restoration center operations. G&A costs were as follows:
* Represents the basis point change in G&A as a percent of total revenues as compared to the corresponding periods of the prior fiscal year.
The increase in G&A costs as a percent of total revenues during fiscal year 2005 was primarily due to the addition of the hair restoration
centers, which have slightly higher G&A costs as a percent of total revenues due to the marketing-intensive nature of that business, as well as
increased professional fees related to the June 30, 2005 Sarbanes-Oxley 404 compliance effort and legal fees stemming from a law suit related
to the Fair Labor Standards Act. Additionally, we identified an issue relating to the potential taxability of certain benefits provided to our
employees during the fourth quarter of fiscal year 2005. We established an accrual during our fourth fiscal quarter to address this matter and are
currently in the process of resolving this issue. During fiscal year 2004, G&A costs improved as a percent of total consolidated revenues
primarily due to salon same-store sales increasing at a faster rate than the fixed cost components of G&A.
37
Expense as %
Site
of Total
Increase (Decrease) Over Prior Fiscal Year
Years Ended June 30,
Operating
Revenues
Dollar
Percentage
Basis Point*
(Dollars in thousands)
2005
$
183,056
8.3
%
$
19,691
12.1
%
(20
)
2004
163,365
8.5
21,192
14.9
10
2003
142,173
8.4
18,258
14.7
(10
)
Expense as %
of Total
Increase (Decrease) Over Prior Fiscal Year
Years Ended June 30,
G&A
Revenues
Dollar
Percentage
Basis Point*
(Dollars in thousands)
2005
$
260,207
11.9
%
$
45,597
21.2
%
70
2004
214,610
11.2
19,047
9.7
(40
)
2003
195,563
11.6
36,941
23.3
70