Supercuts 2005 Annual Report Download - page 37
Download and view the complete annual report
Please find page 37 of the 2005 Supercuts annual report below. You can navigate through the pages in the report by either clicking on the pages listed below, or by using the keyword search tool below to find specific information within the annual report.-
 1
1 -
2
-
3
-
4
-
5
-
6
-
7
-
8
-
9
-
10
-
11
-
12
-
13
-
14
-
15
-
16
-
17
-
18
-
19
-
20
-
21
-
22
-
23
-
24
-
25
-
26
-
 27
27 -
 28
28 -
 29
29 -
 30
30 -
 31
31 -
 32
32 -
 33
33 -
 34
34 -
 35
35 -
 36
36 -
 37
37 -
 38
38 -
 39
39 -
 40
40 -
 41
41 -
 42
42 -
 43
43 -
 44
44 -
 45
45 -
 46
46 -
 47
47 -
48
-
49
-
50
-
51
-
52
-
53
-
54
-
55
-
56
-
57
-
58
-
59
-
60
-
61
-
62
-
63
-
64
-
65
-
66
-
67
-
68
-
69
-
70
-
71
-
72
-
73
-
74
-
75
-
76
-
77
-
78
-
79
-
80
-
81
-
82
-
83
-
84
-
85
-
86
-
87
-
88
-
89
-
90
-
91
-
92
-
93
-
94
-
95
-
96
-
97
-
98
-
99
-
100
-
101
-
102
-
103
-
104
-
105
-
106
-
107
-
108
-
109
-
110
-
111
-
112
-
113
-
114
-
115
-
116
-
117
-
118
-
119
-
120
-
121
 |
 |

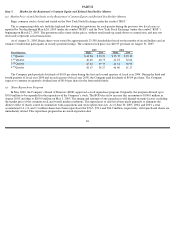
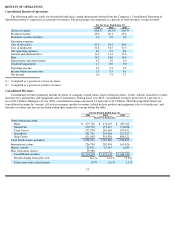
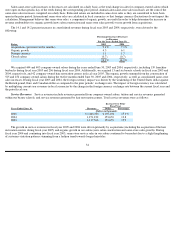
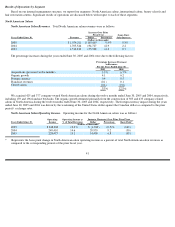
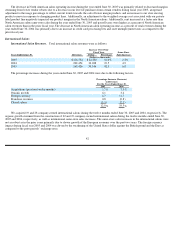
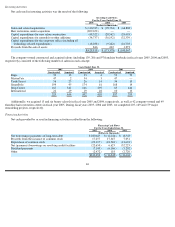
Gross Margin (Excluding Depreciation)
Our cost of revenues primarily includes labor costs related to salon employees, beauty school instructors and hair restoration center
employees, the cost of product used in providing services and the cost of products sold to customers and franchisees. The resulting gross
margin was as follows:
* Represents the basis point change in total margin as a percent of service and product revenues as compared to the corresponding periods
of the prior fiscal year.
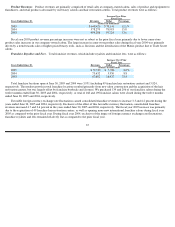
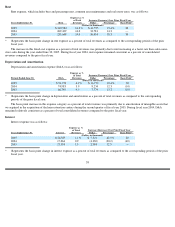
Service Margin (Excluding Depreciation). Service margin was as follows:
* Represents the basis point change in service margin as a percent of service revenues as compared to the corresponding periods of the prior
fiscal year.
The basis point decrease in service margins during the year ended June 30, 2005 was primarily related to increased payroll taxes and an
increased cost of goods used in services during fiscal year 2005. The slight basis point decrease in service margins during fiscal year 2004 was
primarily related to an increase in credit card processing fees and state unemployment taxes, partially offset by improved payroll costs as a
percent of service revenues.
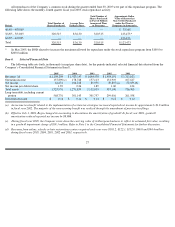
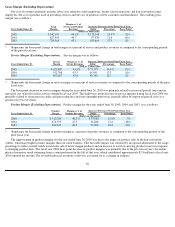
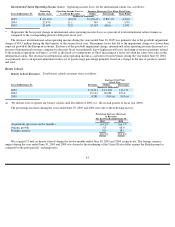
Product Margin (Excluding Depreciation). Product margin for the years ended June 30, 2005, 2004, and 2003, was as follows:
* Represents the basis point change in product margin as a percent of product revenues as compared to the corresponding periods of the
prior fiscal year.
The improvement in product margins for the year ended June 30, 2005 was due to the impact of product sales in the hair restoration
centers, which have higher product margins than our salon business. This favorable impact was softened by an upward adjustment to the usage
percentage to reflect current trends towards the sale of lower margin products and an increase to our slow-moving product reserve in response
to changing product lines. The fiscal year 2004 basis point decrease in product margins was primarily due to the prior fiscal year’s favorable
physical inventory result stemming from a count performed in the fall of that year, which contributed approximately $2.8 million to fiscal year
2003 reported net income. The favorable physical inventory result was accounted for as a change in estimate
36
Margin as % of
Total
Service and Product
Increase (Decrease) Over Prior Fiscal Year
Years Ended June 30,
Margin
Revenues
Dollar
Percentage
Basis Point*
(Dollars in thousands)
2005
$
942,671
44.6
%
$
115,168
13.9
%
(10
)
2004
827,503
44.7
97,939
13.4
(40
)
2003
729,564
45.1
107,664
17.3
80
Service
Margin as % of
Increase (Decrease) Over Prior Fiscal Year
Years Ended June 30,
Margin
Service Revenues
Dollar
Percentage
Basis Point*
(Dollars in thousands)
2005
$
629,887
43.0
%
$
77,179
14.0
%
(50
)
2004
552,708
43.5
65,091
13.3
(10
)
2003
487,617
43.6
69,760
16.7
20
Product
Margin as % of
Increase (Decrease) Over Prior Fiscal Year
Years Ended June 30,
Margin
Product Revenues
Dollar
Percentage
Basis Point*
(Dollars in thousands)
2005
$
312,784
48.2
%
$
37,989
13.8
%
70
2004
274,795
47.5
32,848
13.6
(100
)
2003
241,947
48.5
37,904
18.6
210