Supercuts 2005 Annual Report Download - page 34
Download and view the complete annual report
Please find page 34 of the 2005 Supercuts annual report below. You can navigate through the pages in the report by either clicking on the pages listed below, or by using the keyword search tool below to find specific information within the annual report.-
 1
1 -
2
-
3
-
4
-
5
-
6
-
7
-
8
-
9
-
10
-
11
-
12
-
13
-
14
-
15
-
16
-
17
-
18
-
19
-
20
-
21
-
22
-
23
-
 24
24 -
 25
25 -
 26
26 -
 27
27 -
 28
28 -
 29
29 -
 30
30 -
 31
31 -
 32
32 -
 33
33 -
 34
34 -
 35
35 -
 36
36 -
 37
37 -
 38
38 -
 39
39 -
 40
40 -
 41
41 -
 42
42 -
 43
43 -
 44
44 -
45
-
46
-
47
-
48
-
49
-
50
-
51
-
52
-
53
-
54
-
55
-
56
-
57
-
58
-
59
-
60
-
61
-
62
-
63
-
64
-
65
-
66
-
67
-
68
-
69
-
70
-
71
-
72
-
73
-
74
-
75
-
76
-
77
-
78
-
79
-
80
-
81
-
82
-
83
-
84
-
85
-
86
-
87
-
88
-
89
-
90
-
91
-
92
-
93
-
94
-
95
-
96
-
97
-
98
-
99
-
100
-
101
-
102
-
103
-
104
-
105
-
106
-
107
-
108
-
109
-
110
-
111
-
112
-
113
-
114
-
115
-
116
-
117
-
118
-
119
-
120
-
121
 |
 |

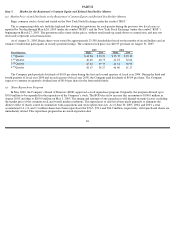
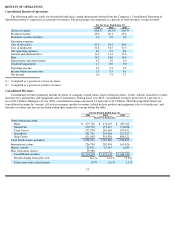
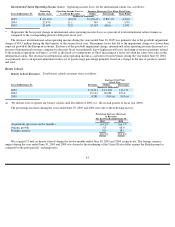
RESULTS OF OPERATIONS
Consolidated Results of Operations
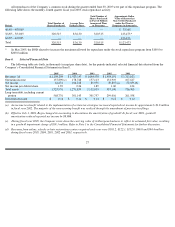
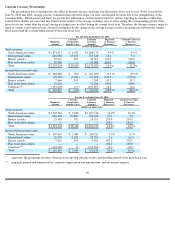
The following table sets forth, for the periods indicated, certain information derived from the Company’s Consolidated Statement of
Operations in Item 8, expressed as a percent of revenues. The percentages are computed as a percent of total revenues, except as noted.
(1)
Computed as a percent of service revenues.
(2)
Computed as a percent of product revenues.
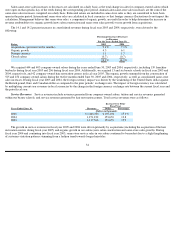
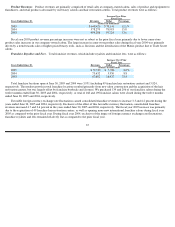
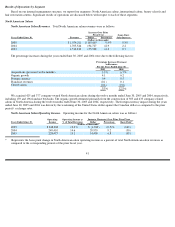
Consolidated Revenues
Consolidated revenues primarily include revenues of company-owned salons, hair restoration centers, beauty schools, franchise royalties,
franchise fees and product and equipment sales to franchisees. During fiscal year 2005, consolidated revenues increased 14.1 percent to a
record $2.2 billion. During fiscal year 2004, consolidated revenues increased 14.2 percent to $1.9 billion. The following table details our
consolidated revenues by concept. All service revenues, product revenues (which include product and equipment sales to franchisees), and
franchise royalties and fees are included within their respective concept within the table.
33
For the Years Ended June 30,
2005
2004
2003
Service revenues
66.8
%
66.1
%
66.4
%
Product revenues
29.6
30.1
29.6
Franchise royalties and fees
3.6
3.8
4.0
Operating expenses:
Cost of service(1)
57.0
56.5
56.4
Cost of product(2)
51.8
52.5
51.5
Site operating expenses
8.3
8.5
8.4
General and administrative
11.9
11.2
11.6
Rent
14.2
14.0
14.0
Depreciation and amortization
4.2
3.9
4.0
Goodwill impairment
1.7
0.0
0.0
Operating income
6.3
9.3
9.3
Income before income taxes
5.3
8.5
8.1
Net income
2.9
5.4
5.1
For the Periods Ended June 30,
2005
2004
2003
(Dollars in thousands)
North American salons:
Regis
$
475,736
$
476,107
$
435,212
MasterCuts
172,792
173,415
170,288
Trade Secret
252,934
242,604
209,671
SmartStyle
351,741
294,564
227,527
Strip Center
621,008
518,856
468,121
Total North American Salons
1,874,211
1,705,546
1,510,819
International salons
226,784
202,454
169,426
Beauty schools
33,911
15,143
4,285
Hair restoration centers
59,388
—
—
Consolidated revenues
$
2,194,294
$
1,923,143
$
1,684,530
Percent change from prior year
14.1
%
14.2
%
15.8
%
Salon same
-
store sales increase
0.9
%
2.6
%
1.2
%