Supercuts 2005 Annual Report Download - page 43
Download and view the complete annual report
Please find page 43 of the 2005 Supercuts annual report below. You can navigate through the pages in the report by either clicking on the pages listed below, or by using the keyword search tool below to find specific information within the annual report.-
 1
1 -
2
-
3
-
4
-
5
-
6
-
7
-
8
-
9
-
10
-
11
-
12
-
13
-
14
-
15
-
16
-
17
-
18
-
19
-
20
-
21
-
22
-
23
-
24
-
25
-
26
-
27
-
28
-
29
-
30
-
31
-
32
-
 33
33 -
 34
34 -
 35
35 -
 36
36 -
 37
37 -
 38
38 -
 39
39 -
 40
40 -
 41
41 -
 42
42 -
 43
43 -
 44
44 -
 45
45 -
 46
46 -
 47
47 -
 48
48 -
 49
49 -
 50
50 -
 51
51 -
 52
52 -
 53
53 -
54
-
55
-
56
-
57
-
58
-
59
-
60
-
61
-
62
-
63
-
64
-
65
-
66
-
67
-
68
-
69
-
70
-
71
-
72
-
73
-
74
-
75
-
76
-
77
-
78
-
79
-
80
-
81
-
82
-
83
-
84
-
85
-
86
-
87
-
88
-
89
-
90
-
91
-
92
-
93
-
94
-
95
-
96
-
97
-
98
-
99
-
100
-
101
-
102
-
103
-
104
-
105
-
106
-
107
-
108
-
109
-
110
-
111
-
112
-
113
-
114
-
115
-
116
-
117
-
118
-
119
-
120
-
121
 |
 |

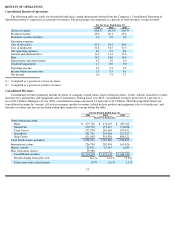
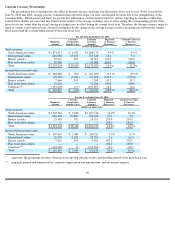
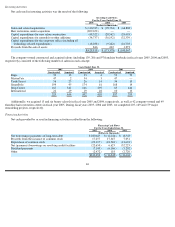
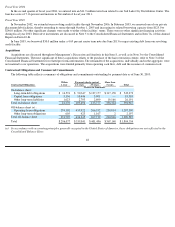
The decrease in North American salon operating income during the year ended June 30, 2005 was primarily related to decreased margins
stemming from lower vendor rebates due to a decrease in our level of purchases from certain vendors during fiscal year 2005, an upward
adjustment to the usage percentage to reflect current trends towards the sale of lower margin products and an increase to our slow-moving
product reserve in response to changing product lines. Additionally, an adjustment to the weighted average cost associated with our private
label product line negatively impacted our product margins in the North American salons. Additionally, rent increased at a faster rate than
North American salon same
-store sales during the year ended June 30, 2005 and payroll taxes were higher as a percent of North American
salon revenues than in the prior fiscal year. The decrease in North American salon operating income as a percent of total revenues during the
year ended June 30, 2004 was primarily due to an increase in credit card processing fees and state unemployment taxes as compared to the
prior fiscal year.
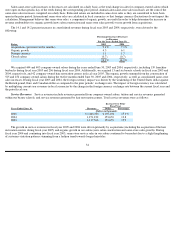
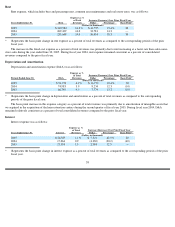
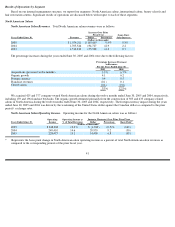
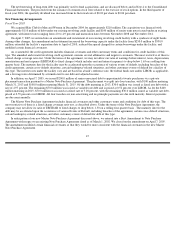
International Salons
International Salon Revenues. Total international salon revenues were as follows:
The percentage increases during the years ended June 30, 2005 and 2004 were due to the following factors.
We acquired 19 and 28 company-owned international salons during the twelve months ended June 30, 2005 and 2004, respectively. The
organic growth stemmed from the construction of 22 and 19 company-owned international salons during the twelve months ended June 30,
2005 and 2004, respectively, as well as international same-store sales increases. The same-store sales increases in the international salons were
not as robust as in the prior years primarily due to slower growth of the European economy over the past two years. The foreign currency
impact during fiscal year 2005 and 2004 was driven by the weakening of the United States dollar against the British pound and the Euro as
compared to the prior periods’ exchange rates.
42
Increase Over Prior
Fiscal Year
Same
-
Store
Years Ended June 30,
Revenues
Dollar
Percentage
Sales Increase
(Dollars in thousands)
2005
$
226,784
$
24,330
12.0
%
2.3
%
2004
202,454
33,028
19.5
4.9
2003
169,426
50,346
42.3
6.0
Percentage Increase (Decrease)
in Revenues
For the Years Ended June 30,
2005
2004
Acquisitions (previous twelve months)
1.7
%
7.3
%
Organic growth
6.1
3.4
Foreign currency
6.7
11.7
Franchise revenues
0.8
(0.8
)
Closed salons
(3.3
)
(2.1
)
12.0
%
19.5
%